
Master the customer retention metrics that matter. Get definitions, formulas, benchmarks, and a practical playbook to measure and act on retention.
Most advice about customer retention metrics starts with the wrong question: “What's a good retention rate?” That question produces tidy benchmark slides and poor decisions. A single number can't tell a growth leader whether customers are leaving, shrinking their contracts, failing to pay, or expanding enough to hide those losses.
Retention is a portfolio, not a universal checklist. A self-serve product priced at $30 per month needs different instruments from an enterprise SaaS contract worth $250k. A subscription business can expand seats or plans. An ecommerce brand has no equivalent upgrade path, so repeat purchase behavior matters more. The dashboard should reflect how customers buy, use, renew, and grow, not what happens to be popular in board meetings.
The benchmark often used to justify retention investment illustrates the stakes. A 5% increase in customer retention can raise profits by 25% to 95%, depending on industry and cost structure, as summarized by this customer retention benchmark. The right metric identifies the lever behind that improvement. The wrong one creates activity without economic progress.
A solitary retention figure is a compressed average. It can hide cohort behavior, adoption curves, customer mix, and the difference between a small account leaving and a major account contracting. A board deck showing strong net revenue retention might still conceal serious logo churn among newer customers, while a respectable logo retention rate might mask shrinking revenue from the accounts that remain.
SaaS operators need to separate logo retention, gross revenue retention, net revenue retention, and cohort retention. Ecommerce operators need repeat purchase rate, purchase frequency, and revenue per buyer. The choice depends on contract structure, price point, purchase frequency, and whether expansion is part of the growth motion. A leader building a measurement system can use principles from marketing analytics to connect each metric to a commercial decision.
Practical rule: If a metric can't trigger a specific owner, workflow, or experiment, it doesn't belong on the primary retention dashboard.
A $30 monthly self-serve product and a $250k enterprise contract demand different measurement instruments. The first needs close attention to monthly churn, activation, and payment recovery. The second needs renewal quality, contraction, expansion, and account-level risk. SaaS businesses often prioritize NRR because expansion is a real revenue lever. Ecommerce teams should prioritize repeat purchase rate because most retail transactions have no upgrade path.
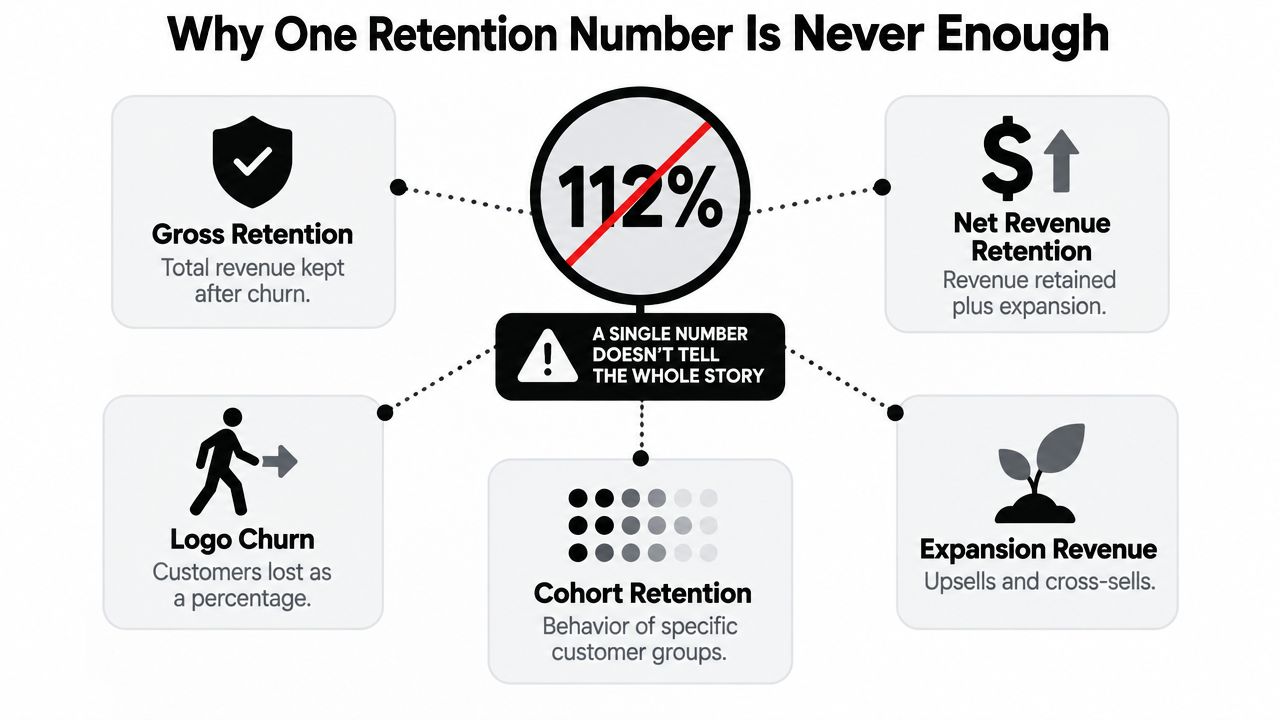
Optimizing one number invites the wrong intervention. Aggressive upsells won't fix a product that bleeds customers, and a win-back campaign may be wasteful when better onboarding would have prevented the churn. The useful question is: which combination of metrics describes unit economics, and which lever should the team pull this quarter?
Every SaaS dashboard needs three definitions before any analysis begins. Logo retention measures the percentage of paying customer accounts kept during a period. The standard cohort formula is:
Logo retention = retained customers from the starting cohort ÷ customers in the cohort at period start × 100
Gross Revenue Retention, or GRR, measures the recurring revenue preserved from the starting cohort after churn and contraction. It excludes expansion, so it isolates the quality of existing revenue:
GRR = (starting recurring revenue − churn − contraction) ÷ starting recurring revenue × 100
Net Revenue Retention, or NRR, includes expansion from upsells, cross-sells, seat growth, and price increases:
NRR = (starting recurring revenue − churn − contraction + expansion) ÷ starting recurring revenue × 100
Consider a SaaS cohort beginning with $1.2M ARR from 100 customers. Five customers leave, representing $60k, three accounts contract by $40k, and eight accounts expand by $95k. Logo retention is 95%. GRR is 91.7%, calculated as ($1.2M − $60k − $40k) ÷ $1.2M. NRR is 99.6%, calculated as ($1.2M − $60k − $40k + $95k) ÷ $1.2M.
The example matters because finance teams often use NRR in valuation and growth-efficiency conversations, while product and customer success teams need GRR to see whether the installed base is holding its value before expansion is added.
| Metric | Formula | What It Measures | Worked Example (Starting $1.2M ARR, 100 logos) | Value |
|---|---|---|---|---|
| Logo Retention | Retained logos ÷ starting logos × 100 | Accounts kept | 95 of 100 retained | 95% |
| GRR | (Starting ARR − churn − contraction) ÷ starting ARR × 100 | Recurring revenue kept before expansion | ($1.2M − $60k − $40k) ÷ $1.2M | 91.7% |
| NRR | (Starting ARR − churn − contraction + expansion) ÷ starting ARR × 100 | Revenue kept plus expansion | ($1.2M − $60k − $40k + $95k) ÷ $1.2M | 99.6% |
Teams assessing downstream economics should connect these measures to customer lifetime value. A high NRR can support stronger lifetime value, but it can't compensate for unexamined customer loss forever.
Churn rate is a loss signal, not a diagnosis. For logos:
Churn rate = lost customers ÷ starting customers × 100
Customer retention rate excludes newly acquired customers: ((end customers − new customers) ÷ starting customers) × 100. Use the customer retention rate formula when you need to verify the calculation. Churn and retention describe opposite outcomes, yet neither identifies the reason for the loss.
Build the next layer by separating voluntary churn from involuntary churn. Voluntary churn means a customer actively cancels because of perceived value, pricing, product gaps, or a competitor. Assign the next-day investigation to product, positioning, pricing, and customer success teams. Involuntary churn follows a failed payment caused by an expired card, insufficient funds, or a banking error. Assign it to billing operations, retry logic, dunning, and payment-method recovery.
Track the mix with:
Involuntary churn share = involuntary churn ÷ total churn × 100
The often-used threshold of roughly 25% of total churn is a management heuristic, not a universal benchmark. Treat it as a prompt to inspect payment recovery, not as a pass or fail grade. For another calculation reference, see Suby on retention.
| Churn Type | Formula | Driver Category | Typical Intervention | Example (100 logos, 5 lost) |
|---|---|---|---|---|
| Total logo churn | Lost logos ÷ starting logos × 100 | Combined loss | Segment the causes | 5% if 5 logos leave |
| Voluntary churn | Voluntary losses ÷ starting logos × 100 | Value, product, price, competition | Research, save play, adoption work | 4% if 4 cancel |
| Involuntary churn | Failed-payment losses ÷ starting logos × 100 | Billing and payment operations | Retries, dunning, payment updates | 4% if 4 fail to pay |
| Revenue churn | Lost and contracted revenue ÷ starting revenue × 100 | Commercial value loss | Protect large revenue pockets | Requires revenue-weighted data |
Do not launch a generic retention campaign before classifying the loss. A 5% monthly logo churn rate driven mainly by voluntary cancellations requires a structural response across value, product, or pricing. The same headline rate driven mainly by recoverable failed payments calls for better retries, dunning, and payment updates. Start with the churn reduction framework, then assign each cause to an owner and a next-day action.
Net revenue retention (NRR) tracks what happens to a fixed starting revenue cohort. It combines starting MRR, expansion, contraction, and churn:
NRR = (starting MRR + expansion − contraction − churn) ÷ starting MRR × 100
A company can post 120% NRR while losing customers. A cohort beginning at $1M MRR could lose $80k to churn, contract by $40k, and expand by $320k. The result is 120% NRR, despite losing 8% of starting revenue to churn before expansion. Logo churn could be worse if smaller accounts leave while larger accounts expand.
Use NRR to judge the cohort's revenue trajectory. Use GRR to expose the revenue that survived without expansion:
GRR = (starting MRR − contraction − churn) ÷ starting MRR × 100
In the example, GRR is 88% and NRR is 120%. That gap is the operating signal. A high NRR can conceal weak retention among smaller customers, while a low GRR points to a value, product, pricing, or service problem that expansion cannot disguise.
| Component | Gross Revenue Retention | Net Revenue Retention |
|---|---|---|
| Starting revenue | Included | Included |
| Churn | Subtracted | Subtracted |
| Contraction | Subtracted | Subtracted |
| Expansion | Excluded | Added |
| Primary question | How much revenue survived? | How did the cohort change after expansion? |
Dollar-based NRR gives larger accounts more weight, so it fits high-ACV, expansion-led SaaS. Logo-based net retention answers a different question: how many customer relationships remain? Choose both when customer volume and implementation capacity affect growth.
The 2023 SaaS Capital benchmark reported median NRR of 102% and median GRR of 91% across SaaS companies in its SaaS retention benchmark report. Use understanding NRR benchmarks to frame comparisons, not to set a universal target. NRR belongs on the board dashboard. The next-day operating actions belong to GRR, logo churn, cohort cuts, and revenue marketing, which connects expansion work to revenue outcomes.
Ecommerce teams shouldn't force SaaS vocabulary onto retail behavior. A store doesn't retain a “logo” in the contractual sense. It earns another purchase.
Repeat purchase rate is the share of customers who buy again:
Repeat purchase rate = customers with two or more purchases ÷ total customers × 100
Purchase frequency measures orders per unique customer:
Purchase frequency = total orders ÷ unique customers
Average order value, or AOV, is:
AOV = total revenue ÷ total orders
A simple customer lifetime value estimate can combine AOV, purchase frequency, and the period over which the customer remains active:
CLV = average order value × purchases per customer over the relationship
The measurement window needs to match the product. A replenishment product deserves a repurchase window tied to its normal buying cycle. A practical rule is to review repeat purchase performance over roughly twice the average purchase cycle, then compare that early signal with later revenue per buyer. A 60-day repeat rate can be more actionable than blended CLV because it gives the lifecycle team a near-term behavior to influence.
| Metric | Formula | Watch Out For |
|---|---|---|
| Repeat purchase rate | Returning customers ÷ total customers × 100 | Exclude one-time gift recipients where possible |
| Purchase frequency | Orders ÷ unique customers | Separate wholesale and DTC buyers |
| AOV | Revenue ÷ orders | Treat refunds and discounts consistently |
| CLV | AOV × purchases per customer over the relationship | Keep the observation window explicit |
| Repurchase window | Review period linked to buying cycle | Avoid comparing seasonal and replenishment products directly |
Subscription boxes borrow recurring-revenue logic, but cancellation timing and skipped deliveries require separate treatment. Refunds can distort revenue, gift orders can inflate acquisition counts without creating a relationship, and wholesale orders can overwhelm DTC behavior. The ecommerce marketing automation guide can support lifecycle workflows, but the data model must remain clean first.
Blended retention answers too little. It combines old and new customers, high and low value accounts, and customers exposed to different onboarding, pricing, and product experiences. Monthly acquisition cohorts show whether the business is improving or carrying the strength of older customers.
Build a table with the acquisition month on the rows and months since acquisition across the columns. For customer-count retention, divide active customers in each cell by the customers that entered the cohort. For revenue retention, divide cohort revenue in each cell by starting cohort revenue.
| Cohort | M0 | M1 | M2 | M3 | M4 | M5 |
|---|---|---|---|---|---|---|
| January cohort | 100% | Calculate | Calculate | Calculate | Calculate | Calculate |
| February cohort | 100% | Calculate | Calculate | Calculate | Calculate | Not mature |
| March cohort | 100% | Calculate | Calculate | Calculate | Not mature | Not mature |
| April cohort | 100% | Calculate | Calculate | Not mature | Not mature | Not mature |
A warehouse query can follow a simple pattern:
SELECT cohort_month, months_since_start, COUNT(DISTINCT customer_id) AS active_customers FROM customer_activity GROUP BY cohort_month, months_since_start
The query is only useful if the definitions are stable. Refunds should reverse revenue in the period where finance recognizes the adjustment. Reactivations should be labeled separately from uninterrupted retention. Partial periods should be marked immature rather than treated as evidence of performance.
Healthy curves differ by model. B2B SaaS often aims for a curve that flattens after early adoption. Ecommerce commonly shows a step-down after the first order. Gifting or seasonal products can produce a second peak when the buying occasion returns.
Customer-count cohorts answer whether relationships survive. Revenue cohorts answer whether economic value survives. Overlaying product releases, pricing changes, onboarding revisions, and campaign launches on the heatmap gives the team a practical way to investigate causation instead of admiring averages.
Benchmarking should set a starting point, not dictate a universal target. Retention changes sharply by segment, contract size, and buying cycle. A 2022 private SaaS survey reported median customer retention of 87% and median gross dollar retention of 86%. Segment-specific guidance places SMB SaaS around 80% to 87% annual retention, mid-market around 87% to 92%, and enterprise around 92% to 95% or higher, as summarized in segment-specific retention guidance.
Use these ranges to choose the right questions, then replace them with internal cohort targets. For ecommerce, purchase frequency and seasonality make a single annual retention comparison weak. Independent coverage places annual retention around 90% to 95% or higher for enterprise B2B SaaS, compared with roughly 25% to 40% for ecommerce and DTC, as discussed in business-model retention benchmarks.
| Segment | Logo Retention (Annual) | GRR | NRR | Repeat Purchase Rate (Ecommerce) |
|---|---|---|---|---|
| Enterprise SaaS | Roughly 92% to 95% or higher | Segment internally | Expansion-led, often above 100% | Not applicable |
| Mid-market SaaS | Roughly 87% to 92% | Segment internally | Segment internally | Not applicable |
| SMB SaaS | Roughly 80% to 87% | Segment internally | Protect against sub-100% performance | Not applicable |
| Subscription ecommerce | Not applicable | Not applicable | Not applicable | Compare by billing and product cycle |
| Transactional ecommerce | Roughly 25% to 40% annual retention coverage | Not applicable | Not applicable | Compare by repurchase window |
Treat the table as a portfolio, not a dashboard template. Enterprise contracts can tolerate lower logo retention when retained accounts expand enough to support revenue. SMB SaaS can show stronger logo retention while still struggling if customers do not expand and acquisition economics remain weak.
The next-day action depends on the model. Enterprise teams should review contraction and expansion by account. SMB teams should investigate early cancellations and failed payments. Subscription commerce teams should compare retention with billing and product cycles, while transactional commerce teams should set a repurchase window that matches the category.
Holiday cohorts require separate treatment. A seasonal purchase gap can look like churn even when customers are not yet due to buy again. Set targets from internal cohort curves, customer economics, and contract design. External ranges should sharpen the question, then your own model should set the operating target.
A lean dashboard protects revenue better than a crowded one. Enterprise SaaS should lead with NRR, GRR, logo churn, and renewal rate by tier. The metric to remove from the default SaaS view is broad activity volume that doesn't connect to renewal risk. The metric to add is account-level contraction, reviewed monthly for strategic accounts and at the renewal cadence for each tier.
SMB SaaS needs a faster operating loop. Monthly logo churn, trial-to-paid conversion, failed-payment recovery, and activation reveal more than a quarterly NRR average. A team can drop enterprise-style expansion detail from its primary view and add payment recovery status, because a failed card needs a billing workflow rather than an executive business review.
Ecommerce should track repeat purchase rate, purchase frequency, and cohort revenue per buyer. Subscription commerce can add cancellation reasons and skipped-order behavior. Transactional commerce should remove logo retention from the main dashboard and add the repurchase window that matches the product category.
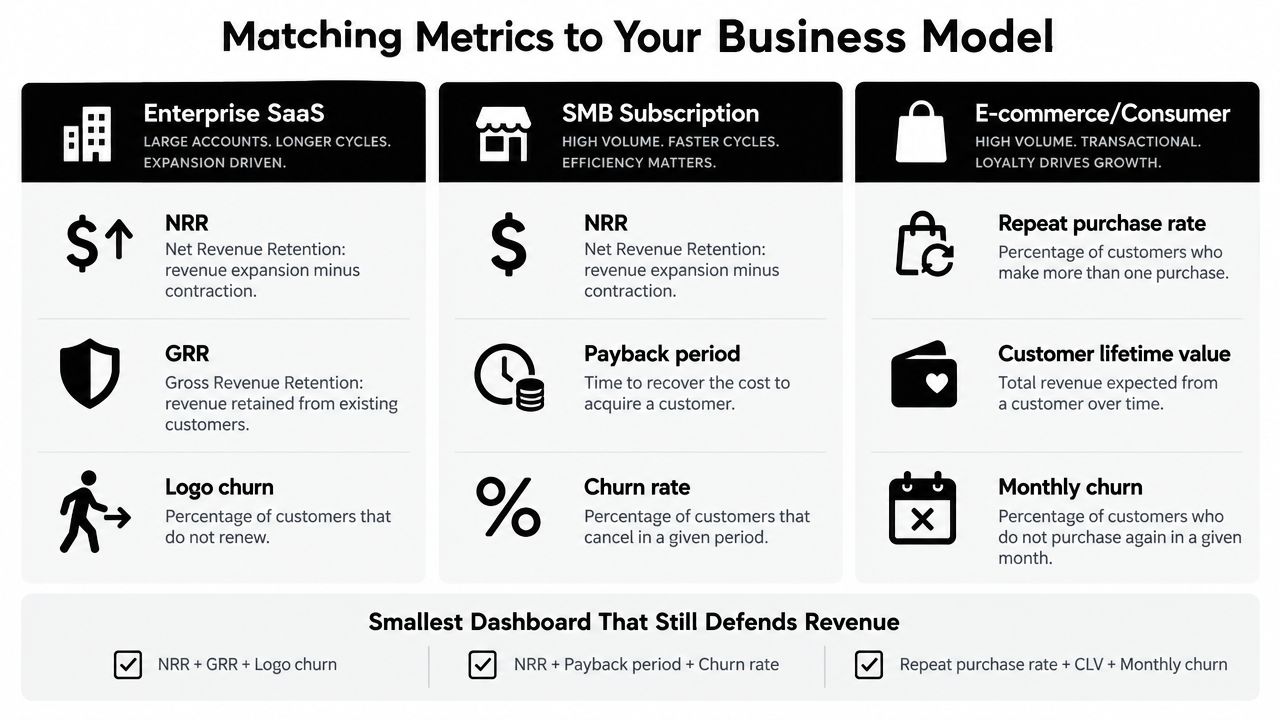
A quarterly-retainer B2B services firm borrows from all three. It needs renewal and contraction views like enterprise SaaS, payment recovery like SMB subscription, and revenue per client cohort like ecommerce. Sprints & Sneakers is one example of a growth agency that connects dashboards, experimentation, and full-funnel measurement for teams that need retention tied to broader commercial performance.
Churn is a lagging event. The cancellation date is when the dashboard records the loss, not when the account became vulnerable. A useful alert system groups earlier signals by owner and response.
The trigger window depends on contract length and customer behavior. A usage decline can precede a renewal problem by weeks, while a payment failure can create immediate risk. Teams should define the response window internally, then test whether alerts lead cancellation often enough to justify their cost.
Small accounts generate noisy signals. Account-size weighting, minimum activity requirements, and human review prevent a single low-volume event from flooding the customer success queue.
A mid-market SaaS team sees NRR fall from 112% to 98% over two quarters. The headline is serious, but it doesn't identify the repair. A 30-day intervention starts by separating churn, contraction, expansion weakness, usage decline, support friction, and payment failure.
Day 0 assigns one owner to the investigation. By day 7, the team has a cohort view that distinguishes contraction from logo churn and identifies whether newer accounts are responsible. A usage drop-off routes an account to an executive sponsor check-in. An NPS detractor response triggers a save play, while a support ticket spike opens a technical account review.
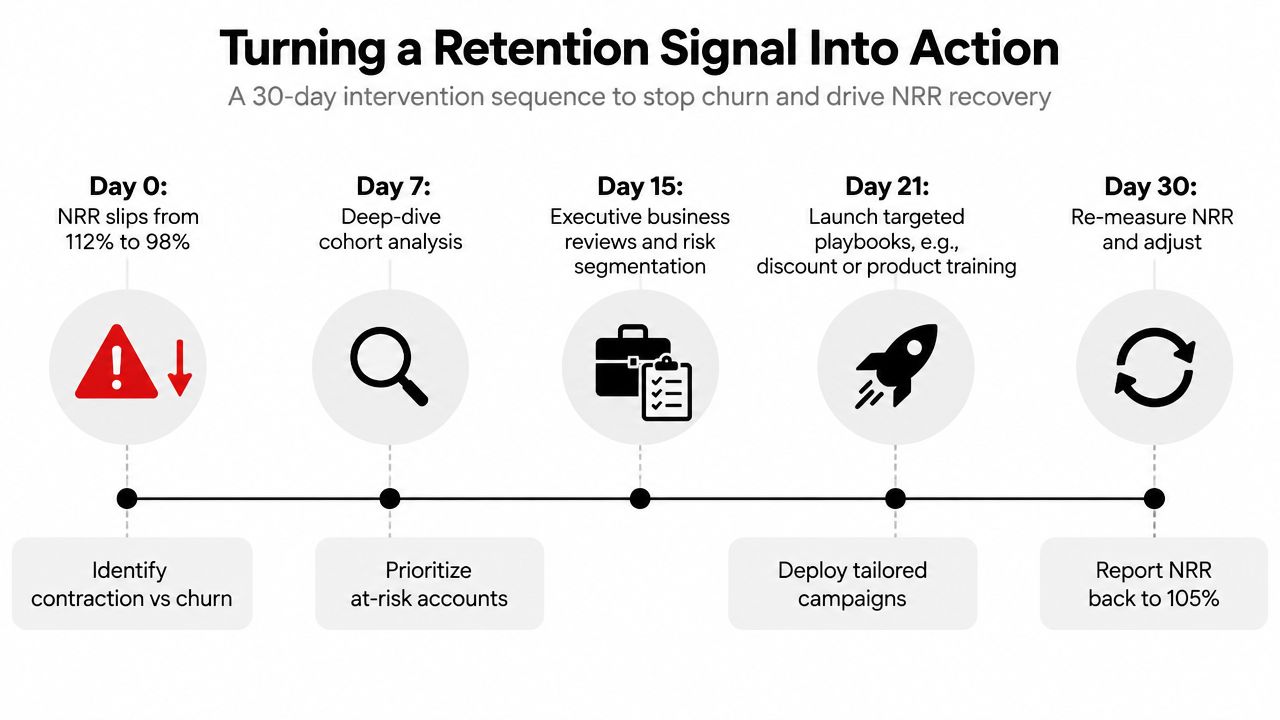
By day 15, customer success has segmented risk by account value, renewal date, product usage, and stated reason for concern. Billing operations owns failed-payment recovery with a retry ladder and payment-method outreach. Product leadership receives a grouped view of repeated friction rather than a list of isolated complaints.
By day 21, the team launches targeted playbooks. One account may need product training, another an executive review, and another a commercial adjustment. By day 30, the team re-measures the cohort and reports whether NRR moved back toward 105%, the outcome shown in the intervention sequence, or whether the underlying issue remains.
The operating principle is simple:
A metric becomes valuable when it names the next owner and the next action.
Retention reporting fails when teams reconcile definitions only after a board meeting. The data stack should make ownership and verification explicit.
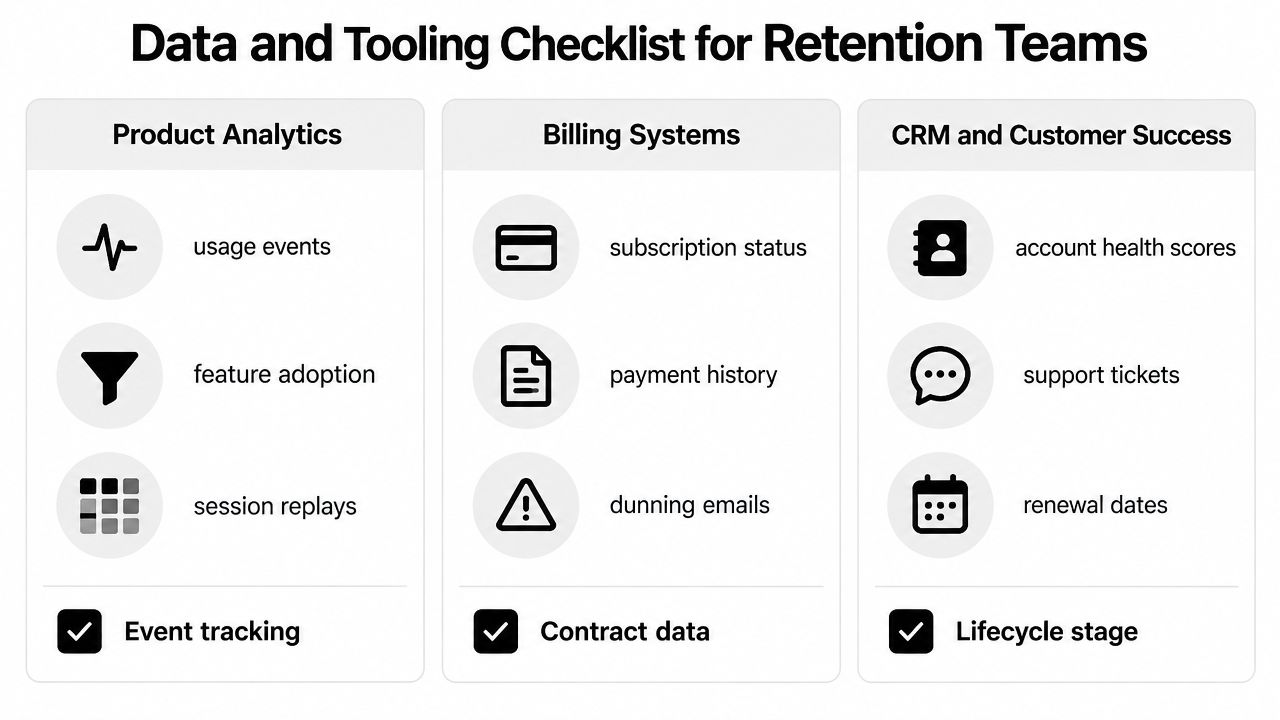
A dashboard is trustworthy only when its totals match the number finance reports and its account list matches the customer team's working book.
The following lookup table ties each metric to its calculation and operating use.
| Metric | Definition | Formula | Defined In | Action In |
|---|---|---|---|---|
| Logo retention | Customers kept from a starting cohort | Retained ÷ starting × 100 | Core Definitions | Matching Metrics |
| GRR | Revenue kept before expansion | (Start − churn − contraction) ÷ start × 100 | Core Definitions | Turning a Signal |
| NRR | Revenue kept after expansion | (Start + expansion − contraction − churn) ÷ start × 100 | NRR Mechanics | Turning a Signal |
| Cohort retention | Retention by acquisition group | Active cohort ÷ starting cohort × 100 | Cohort Analysis | Turning a Signal |
| Repeat purchase rate | Customers who buy again | Returning ÷ total × 100 | Ecommerce Metrics | Matching Metrics |
| CLV | Revenue expected across the relationship | AOV × purchases over relationship | Ecommerce Metrics | Data Checklist |
| Churn rate | Customers or revenue lost | Lost ÷ starting × 100 | Churn Split | Turning a Signal |
| Leading indicators | Early risk signals before churn | Signal-specific | Leading Indicators | Turning a Signal |
Sprints & Sneakers helps B2B SaaS and consumer teams connect retention metrics to full-funnel growth, dashboards, and prioritized experiments. Visit Sprints & Sneakers to request a growth scan and identify the retention bottleneck worth fixing first.
Growth marketing, AI and automation, SEO, performance marketing, retention strategies, and sustainable business practices.
Weekly. Subscribe to our newsletter to get new articles straight to your inbox.
Absolutely. Everything we publish is designed to be actionable. Take it, test it, and make it your own.
Yes. We publish experiments with real numbers. What worked, what didn't, and what we learned.
Our growth team — strategists, performance marketers, data specialists, and AI builders who work on client campaigns every day.
We're open to it. Reach out via our contact page with your topic and we'll take a look.