
Learning from Failures: A Growth Team Playbook for 2026
Learning from failures needs a system. Sort each miss, write a post-mortem, rule out false causes, and report problems early with this growth team playbook.
A test ends red on Monday morning. By lunch, someone wants to kill the idea for good, someone else wants to rerun it unchanged, and the analyst who spotted a tracking problem on Friday hasn't said anything yet because last time that turned into a blame session.
That mess isn't a motivation problem. It's a decision problem. Learning from failures works when a team sorts each miss by type, rules out false causes, then picks one of four moves, repeat, redesign, stop, or scale the fix. Skip the sorting, and the retrospective becomes a story nobody opens again.
Table of Contents
- Sort Each Failure Before You Learn From It
- Rule Out False Causes and Write the Post-Mortem
- Measure Whether Your Team Learns From Misses
- Stop the Line When Checkout or Pricing Breaks
- Build a Review Ritual Your Team Will Use
- Run Your First Failure Review This Week
Sort Each Failure Before You Learn From It
Say a SaaS team launches a new free-trial page and sign-ups drop 18 percent in the first week. The two common reactions are both lazy. Kill the page, and the team may be binning a good idea that never ran cleanly. Rerun it unchanged, and the team may pay twice to disprove the same assumption.
That one drop can mean five different things. Sorting takes ten minutes and decides which conversation is worth having.
Five Types, Five Different Decisions
| Failure type | How to recognize it | Decision | Example |
|---|---|---|---|
| Implementation failure | Test ran differently than designed (wrong audience split, broken variant, late launch) | Fix execution and rerun | Variant B served only to iOS users after a late launch |
| Theory failure | Clean test and clear result, hypothesis disproved | Retire the assumption and write a new hypothesis | Shorter form did not lift demo requests because buyers wanted pricing first |
| Measurement failure | Tracking or data defect invalidates the result | Repair instrumentation, then rerun | Purchase event fired twice on the confirmation page |
| Inconclusive result | No difference beyond noise at the planned sample size | Redesign with a larger expected effect, or stop | Headline test ended with a 2% lift and a wide interval |
| Unacceptable downside | Loss exceeds the agreed limit or breaks trust, compliance or safety | Stop now and add guardrails | Discount banner applied to annual plans for two days |
Theory failure is the only row that teaches something about customers. The other four teach something about the team's own process, instrumentation, or risk limits. Treating them the same wastes the rerun budget on ideas that were already answered, and buries good ideas that never got a fair test. That's why sorting comes before any structured growth experimentation program can compound results.
A failed test isn't one thing. Name the type first, and the next step usually names itself.
Volume makes this unavoidable. In 2024, 46% of ideas in the retail sector failed either to break even or to prove the initial hypothesis, according to Mastercard's 2024 State of Business Experimentation survey of more than 100 Test & Learn clients worldwide. When nearly half of ideas miss, the sorting step is what separates a useful lesson from an expensive write-off.
Apply that to the trial page. If variant traffic skewed mobile, it's implementation. If tracking double counted starts on the control, it's measurement. If the test ran clean at full sample and sign-ups still fell, the assumption is dead and the team should write a sharper one, perhaps that buyers need pricing before a form, not fewer fields.
Rule Out False Causes and Write the Post-Mortem
Teams often stop a checkout test on day six, call it flat, and move on. Two weeks later, someone notices the test reached only a third of its planned sample. The team has no reliable answer about checkout; it has a decision to make about whether the test was capable of answering the question.
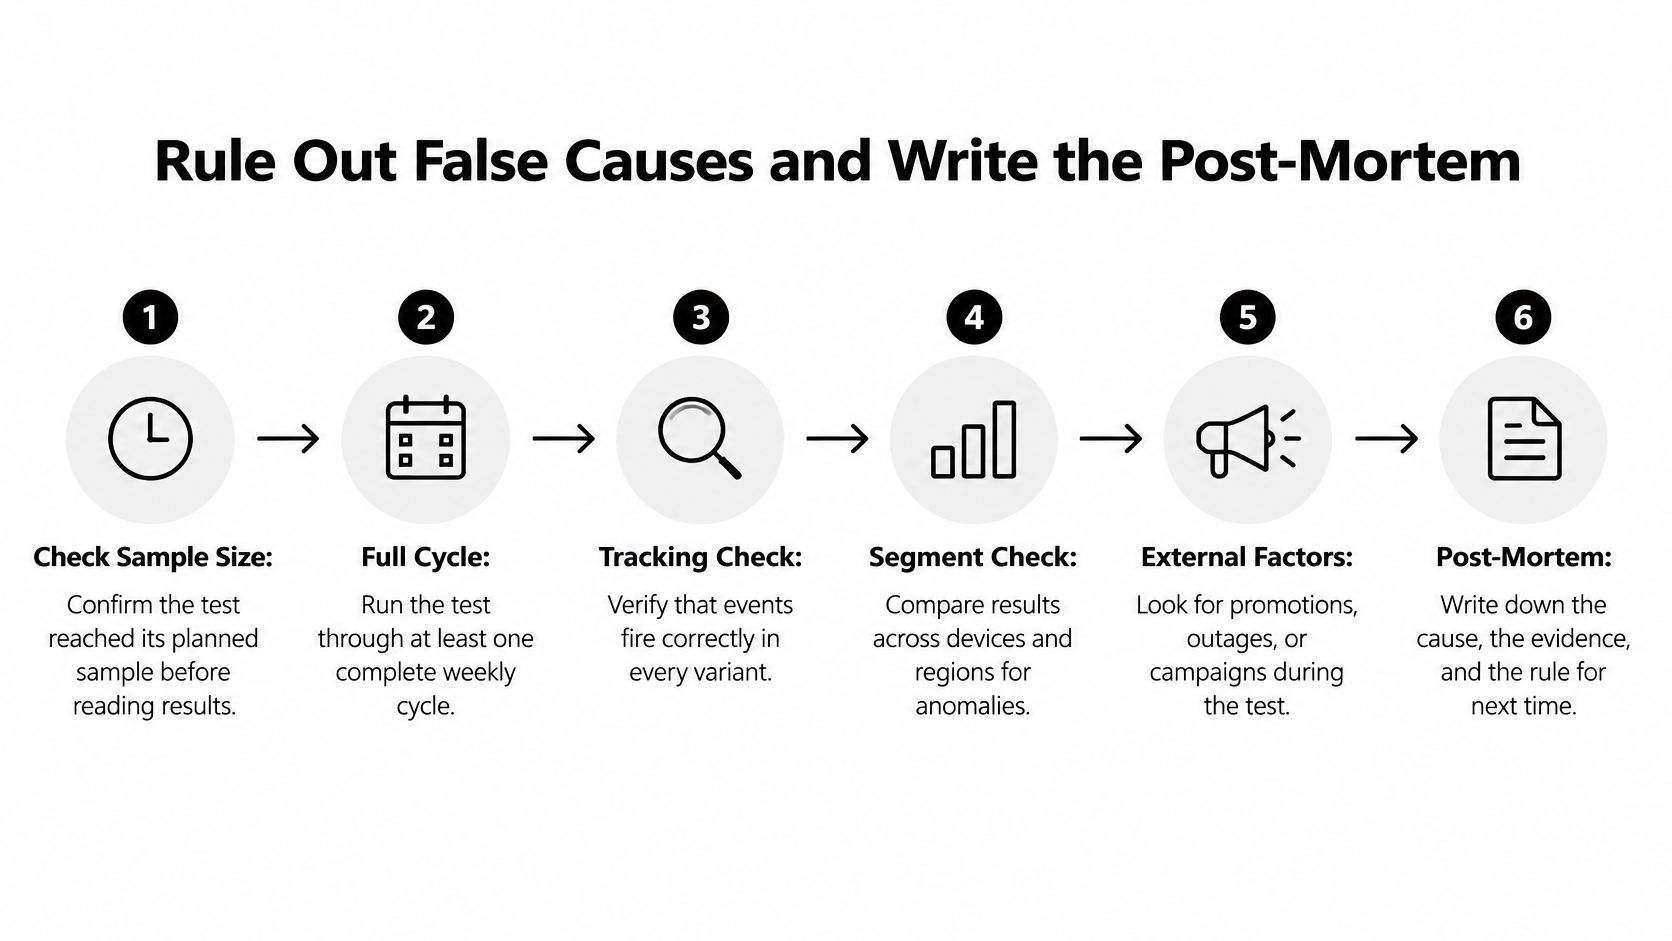
A flat result is a prompt to check whether the test could have detected an effect. Work through the fastest checks first, and log any red flag before deciding whether to repeat, redesign, stop, or scale.
Run Six Checks, Fastest First
| Explanation | Check to run | Red flag |
|---|---|---|
| Tracking defect | Compare event counts with server logs or a second source | Counts differ by more than a few percent |
| Sample too small | Compare achieved sample with the power calculation in the brief | Test stopped early or below planned sample |
| Selection bias | Confirm the split was random and audiences match by source | One variant got a disproportionate share of returning visitors |
| Seasonality | Compare the test window with the same period last year or a holdout | Test ran over a holiday or promotion |
| Channel interaction | Check whether another campaign, email or paid push ran at the same time | Overlapping campaign reached only one variant |
| Novelty effect | Compare first-week results with weeks three and four | Lift fades after the first few days |
- Tracking defect: Compare server-side order or signup counts with analytics events by variant. A gap of more than a few percent makes the result unreliable, even if the chart looks clean.
- Sample too small: Compare achieved exposures with the power calculation's required sample. An early stop leaves a wide interval, so a flat chart may just be inconclusive.
- Selection bias: Compare the new-versus-returning visitor mix, device mix, and source mix by variant. If one arm has more returning visitors, the conversion difference may reflect the audience rather than the copy.
- Seasonality and channel interaction: Check the calendar and campaign schedule. A holiday weekend, sitewide promotion, or email sent to only one segment can obscure the effect of a page change.
- Novelty effect: Break results out by week. If a lift appears only in the first few days, check whether returning users reacted to something new before treating it as a sustained improvement.
If a check flags a defect, fix the implementation or measurement and decide whether a rerun is worth the cost. If the checks pass, record a theory failure and choose whether to stop or redesign around a sharper hypothesis with a larger expected effect. Repeating a headline tweak without changing the question spends the rerun budget without improving the decision.
The same evidence-first habit applies to AI-assisted search reporting. Learn to spot hallucinations in AI search answers before treating a generated summary as evidence. Check the source data before acting on the readout.
Keep the Lesson Narrow
A study of 58 U.S. airlines analyzing aviation-accident data from 2008 through 2018, with 2,332 observations, reported an average of approximately 0.71 accidents per observation with a standard deviation of 2.80. The study found that large failures were associated with positive organizational learning, while small failures could have a negative effect under some conditions. Its analysis also found that firms mainly learned to prevent the same type of failure, rather than a different type.
For growth work, a message mismatch on a landing page says little about pricing, onboarding, or retention. Record the mechanism and conditions precisely. Then decide whether to test that lesson in another stage or audience, rather than treating it as a general rule.
Write the Five-Field Record Within a Week
Write the record while the details are fresh. Keep it to one page and make the decision easy to find.
- Intended outcome: Record the target and minimum detectable effect, such as a 10 percent lift in trial starts at 80 percent power.
- Original setup: Preserve the hypothesis, audience, intervention, and measurement plan as written before launch. Changing them afterward makes the result harder to interpret.
- Observed result: Include the effect, its confidence interval, and exposure counts per variant, not just a winner label.
- Earliest detectable signal: Note the day, segment, or funnel step where results first diverged.
- Containment and next step: Record what was rolled back or paused, then name the next test, its owner, and its date.
For example, if an onboarding email test misses its activation target and results first diverge at the second email on day two, record that finding and the rollback. The next test can change that step alone instead of rebuilding the full sequence.
Practical rule: A colleague who did not run the test should be able to explain the result and the next decision from the record. If they cannot, make the record more specific.
File it where the next brief gets written, so the decision can shape the next round of A/B testing for marketing teams.
Measure Whether Your Team Learns From Misses
A team can run forty failed tests a year and learn almost nothing. Test count measures activity. It doesn't measure whether decisions got better, whether the same tracking bug returned, or whether a landing page lesson helped pricing or onboarding later.
Learning needs its own metrics, reviewed like revenue metrics, with an owner and a trend line.
| Metric | How to calculate | Trend that signals learning |
|---|---|---|
| Documented hypotheses | Experiments with a written prediction before launch, divided by all experiments | Approaching every test; any gap is a process problem |
| Time to detect failure | Days from launch to the first credible signal that results diverge | Shrinking quarter over quarter |
| Failures converted to decisions | Failed tests that led to a logged change, retest or stop, divided by all failed tests | Rising until most failures produce a recorded decision |
| Recurrence rate | Share of new failures that repeat a cause already in the ledger | Falling over two or three quarters |
| Downstream impact | Whether a lesson from one funnel stage improved a later stage in the next two quarters | At least one transferred win per quarter |
Keep a Learning Ledger, Review It Weekly
One row per failed test is enough. Hold four fields, the failure type, the cause, the decision, and the follow-up test. A shared sheet beats a polished dashboard that takes a month to build.
Weekly review does the heavy lifting, especially when paired with clear marketing analytics definitions and reporting habits. Patterns appear fast: unclear ownership on three launches, missing instrumentation on paid campaigns, assumptions that predict effects no page change could plausibly deliver. Paid social teams hit a version of this when launch queues stall, which is why practical guidance to solve creative testing launch bottlenecks is useful context for spotting operational delays masquerading as creative failure.
If the same cause appears three times in a quarter, it becomes a process change, not another experiment.
Then verify the fix. If a tracking checklist was added in January, recurrence for measurement failures should fall by the next quarter. If it doesn't, the checklist is theatre. Downstream impact is the hardest metric and the most valuable, because it forces a team to retest a lesson at a new stage instead of assuming transfer. One transferred win per quarter is a strong signal that records are being read before briefs are written.
Stop the Line When Checkout or Pricing Breaks
A data sync breaks on Monday, and paid media bids on stale conversion data for two days. By the time the weekly review catches it, the campaign has spent against bad signals and tests relying on those conversions are compromised.
Treat operational failures differently from experiments: contain the problem first, then decide whether to repeat, redesign, or stop the affected work.

Toyota's andon system lets a worker signal an abnormal condition and request team-leader assistance. If the issue cannot be resolved before the product moves onward, the line can be stopped. The signal makes a problem visible while there is still time to contain it.
Translate It for a Growth Team Tomorrow
- Set a clear trigger: For example, conversions fall 25 percent below the seven-day average, or a displayed price differs from the billing system.
- Let anyone raise the alert: A person who spots the problem should not need a manager's permission to flag it.
- Assign a response owner: Name who acknowledges the alert and set a response window, such as 30 minutes during business hours.
- Contain the issue: Pause the campaign, roll back the variant, or switch off the sync before debating root cause.
- Record the decision: Log the cause, fix, and whether the problem recurred. Use that record to decide whether to repeat, redesign, or stop the affected test.
The clip below shows the line-stop principle in its original setting.
<iframe width="100%" style="aspect-ratio: 16 / 9;" src="https://www.youtube.com/embed/Gv_Kh7zPuF4" frameborder="0" allow="autoplay; encrypted-media" allowfullscreen></iframe>A visible trigger can catch a stale sync before it distorts more campaign decisions. It also protects checkout work: checkout optimization practices cannot fix defects caused by a broken upstream process. Once contained, classify the failure and choose the next action based on what broke, not on who raised the alarm.
Build a Review Ritual Your Team Will Use
A failed test is easier to report when the review has a clear purpose, a predictable format, and no penalty for an honest result. Teams may hold back when past reports have led to embarrassment, interrogation, or a senior person shutting down discussion.
Meeting mechanics can reduce that risk. Google's Project Aristotle research, covering 180 teams and roughly 250 attributes, identified psychological safety as the strongest predictor of team effectiveness: whether people felt able to admit mistakes, ask questions, challenge decisions, and propose ideas without embarrassment or punishment. The study's findings on psychological safety point to how members interact as more important than team composition.
Three Questions, Senior Voice Last
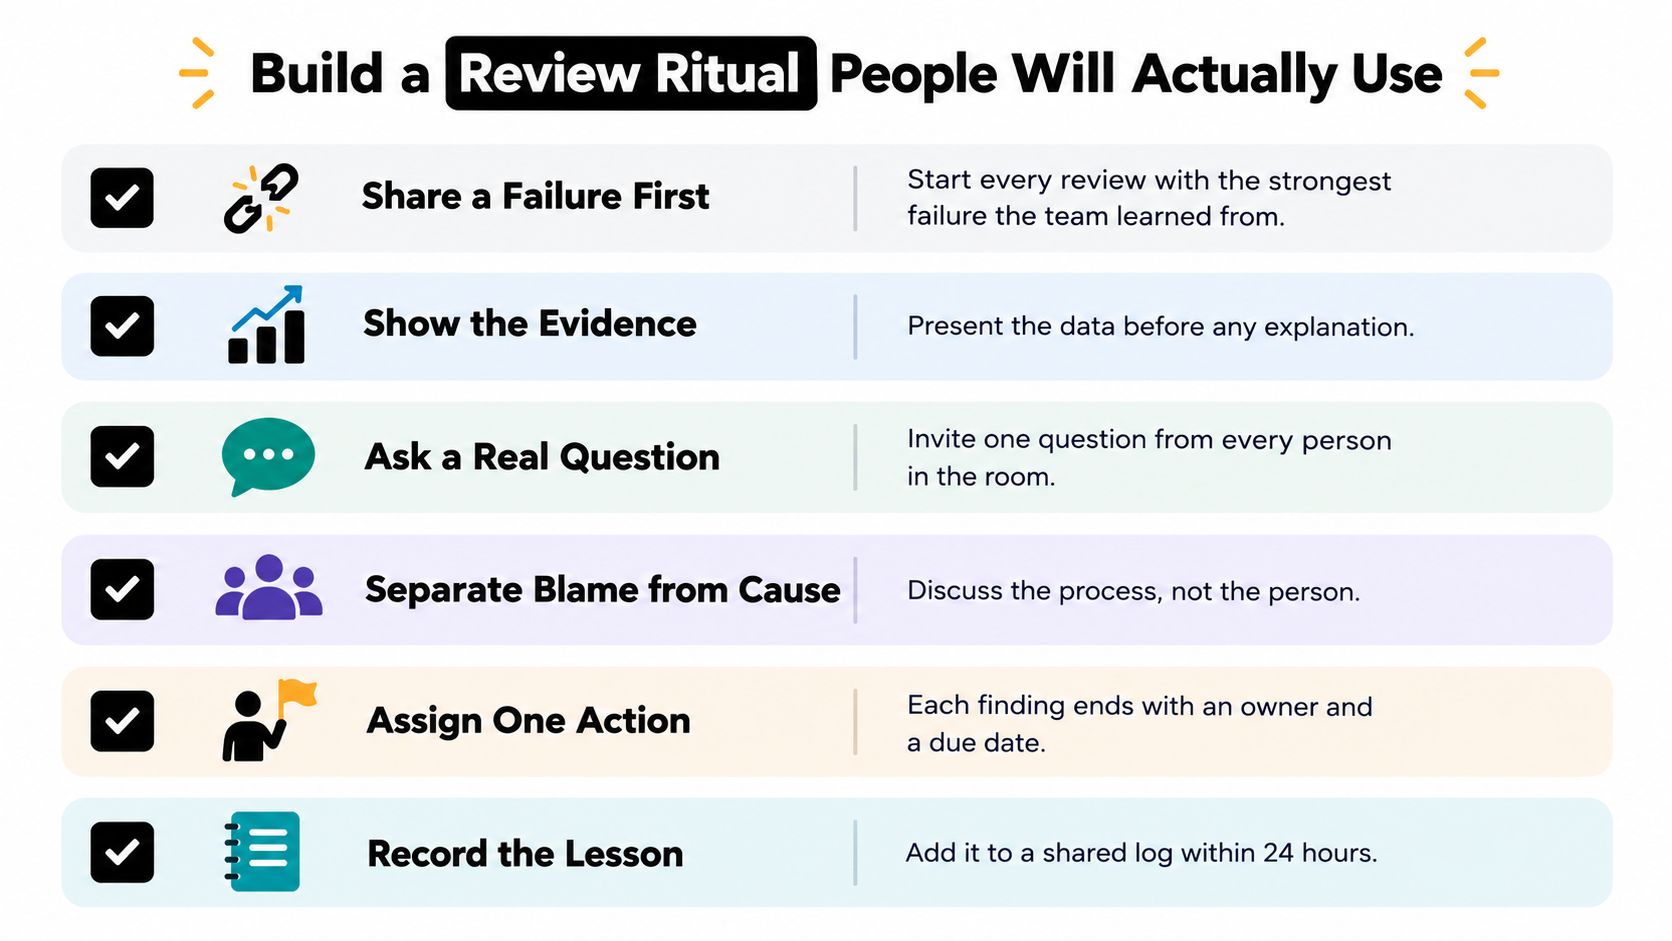
Open each review with three questions: What did the team expect? What happened? What did the result teach you? Ask the most senior person to speak last. This gives the team room to assess the evidence before reacting to a leader's view, a practice that supports a growth mindset in marketing teams.
Record one unexpected result, one failed assumption, and one open question. These details help distinguish a test to repeat from one to redesign or stop. If none emerges, the meeting has produced a status update, not a useful review.
Recognize accurate reporting. Praise a team for ending a campaign once its core hypothesis is disproved; stopping early preserves budget for better-supported tests. Make clear that reporting a miss is part of good decision-making, not a reason to hide the result.
Safety Is Not a License for Sloppiness
Psychological safety should reduce interpersonal fear while keeping analytical standards high. It does not excuse skipped tracking checks, launches without a written hypothesis, or a preventable error recurring across three sprints.
Use this five-item checklist in every review:
- Hypothesis written: It existed before launch, not reconstructed after results arrived.
- Effect size set: A minimum detectable effect was agreed upfront.
- Tracking verified: Events were checked in every variant before traffic scaled.
- Sample explained: Planned sample was reached, or the shortfall is stated plainly.
- Owner named: One person owns the next step, with a date.
Treat the review as a decision point. A sound experiment that misses its target calls for curiosity about the result. A preventable process error calls for accountability and a process fix. Document both so the team can decide whether to repeat, redesign, stop, or scale.
Ask this quarterly: Would a junior analyst report a broken result on Friday afternoon? If the answer is no, change the meeting norms, not the analyst. Catching a weak signal early costs less than finding it after budget is spent and customer trust is damaged.
Run Your First Failure Review This Week
Pick the three most expensive red tests from last quarter, not the easiest ones to discuss. Expensive misses hold the biggest rerun value and the clearest process lessons.
Rank them first with a simple score. Revenue at stake, times the chance the failure was execution or measurement, divided by rerun cost. The top scorer becomes the main case for the session.
A 45-Minute Agenda That Fits One Meeting
- 5 minutes, purpose and ground rule: State the goal and confirm nobody gets blamed for a failed test.
- 10 minutes, sorting: Classify the three failures using the type table, no solution debates yet.
- 15 minutes, one deep record: Walk the top case through all five post-mortem fields end to end.
- 10 minutes, false causes: Run the alternative-explanation checks on anything still labeled theory failure.
- 5 minutes, decisions: Assign one owner and one next test per failure, with dates.
Three actions follow this week. Create the learning ledger as a simple shared sheet, add a stop-the-line trigger for checkout and pricing, and put the three review questions on the next meeting invite so the habit survives busy weeks.
Some funnels are too tangled to untangle in one internal session, with overlapping campaigns, unclear instrumentation, and no agreed bottleneck. In that case Sprints & Sneakers starts with a personalized growth scan that pinpoints the single bottleneck and ranks which failed experiments are worth rerunning across awareness, acquisition, activation, revenue, retention, and referral. External eyes help most when the team can't tell a dead assumption from a broken test.
Either way, the first review doesn't need to be perfect. It needs to happen, produce three classified failures, and end with owners. The second one gets faster because the records start doing the remembering.
Turn last quarter's red tests into next quarter's pipeline with a growth scan that ranks reruns, fixes instrumentation gaps, and pinpoints the one bottleneck limiting results. Visit Sprints & Sneakers to start that conversation and put a repeatable learning system behind every experiment the team runs.
Related articles


Frequently asked questions
Growth marketing, AI and automation, SEO, performance marketing, retention strategies, and sustainable business practices.
Weekly. Subscribe to our newsletter to get new articles straight to your inbox.
Absolutely. Everything we publish is designed to be actionable. Take it, test it, and make it your own.
Yes. We publish experiments with real numbers. What worked, what didn't, and what we learned.
Our growth team — strategists, performance marketers, data specialists, and AI builders who work on client campaigns every day.
We're open to it. Reach out via our contact page with your topic and we'll take a look.