
Learn sales pipeline analysis step by step: stage metrics, velocity, leakage audits, deal segmentation, and how to turn findings into growth experiments.
A CRO can stare at a record pipeline and still finish the quarter well below forecast. The problem usually isn't arithmetic. It's that the dashboard counts deal value, stage labels, and seller activity while ignoring buyer readiness, missing stakeholders, hidden research, and unworked demand.
That's why sales pipeline analysis should be treated as a diagnostic operating system, not a weekly reporting ritual. The useful question isn't “How much pipeline exists?” It's “Where does revenue leak, what evidence explains the leak, and which experiment should fix it first?”
Organizations using AI-driven forecasting achieved nearly 79% average accuracy, compared with approximately 51% for traditional methods, while pipeline health scoring improved revenue-forecast accuracy by 28%, according to research on AI-supported sales forecasting. Those figures don't make AI a substitute for clean data. They reinforce a simpler point: forecasting improves when teams measure pipeline quality rather than admiring its total value.
A practical analysis method moves from stage definitions and conversion to velocity, leakage, buying-group completeness, pre-pipeline signals, and a prioritized experiment backlog. It gives sales, marketing, and revenue operations a shared way to find the bottleneck before adding more volume.
The dashboard looks healthy. Pipeline value is up, late-stage opportunities fill the forecast, and activity reports show busy representatives. Then the quarter closes, several “committed” deals slip, and leadership discovers that the pipeline was mostly a collection of optimistic stage labels.
That failure usually starts with a hidden assumption: an opportunity is treated as a reliable unit of progress because it exists in the CRM. A proposal with no economic buyer, no confirmed decision process, and no recent buyer engagement isn't equivalent to a proposal with those signals. Both may carry the same value and stage, but they shouldn't carry the same forecast confidence.
A useful pipeline review asks what changed in the buyer's process, not what the seller logged. Has the opportunity moved because the buyer completed a meaningful task, or because a representative scheduled another meeting? Has the expected close date been validated against procurement, legal, and implementation steps, or copied forward from the previous review?
The distinction matters because raw pipeline value hides concentration, stalling, poor qualification, and late-period optimism. A large pipeline can be weak when too many deals sit in one stage, depend on one stakeholder, or have repeatedly moved their close date.
Practical rule: A stage should describe buyer evidence, not seller effort.
A rigorous review starts by checking whether stage definitions are consistent, then measures stage-to-stage conversion and time in stage. It audits response leakage, segments opportunities by buying-group coverage, and adds buyer activity that happened before CRM visibility. Only after those checks should leaders decide whether they need more demand, better qualification, faster follow-up, or stronger deal support.
Marketing leaders who want the wider measurement context can also review what marketing analytics means for growth decisions. The central lesson is straightforward: pipeline analysis should explain revenue risk, not merely display it.
A pipeline stage is a decision state with evidence attached. “Qualified” should mean more than a completed call, and “proposal” should mean more than a document sent. Each stage needs an exit rule that proves the buyer has completed a relevant task and that the next commercial step is real.
Start by documenting the minimum dataset for every opportunity:
Without those fields, a dashboard can show activity but can't reliably explain velocity, win rates, or forecast risk. A 2025 CRM implementation study recorded an average 18.2% productivity increase and a 7.1-percentage-point conversion improvement after adoption, illustrating why centralized records and consistently defined stages matter. The figures come from a specific study and shouldn't be treated as a universal outcome, but the operational lesson is sound: clean history is the foundation of useful analysis.
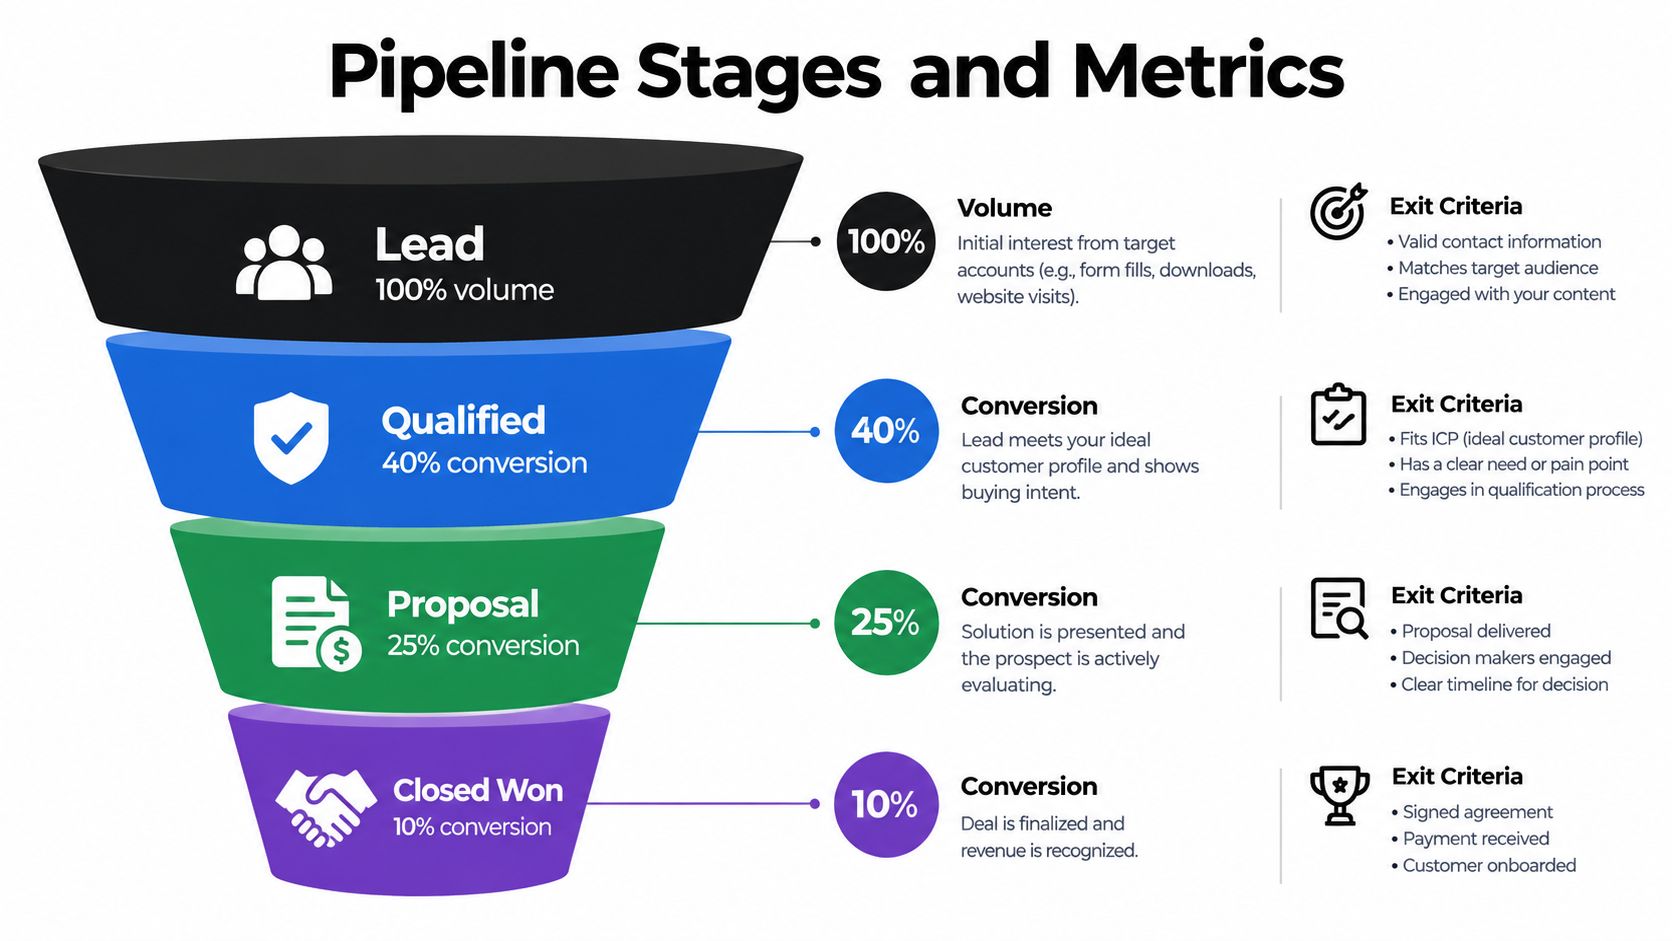
Suppose 100 opportunities enter a qualification stage and 42 advance to proposal. The stage conversion rate is 42%, calculated as 42 divided by 100. If those opportunities represent a combined value of $420,000, the average value is $4,200 per opportunity. These figures are illustrative operating examples, not benchmarks.
The four core metrics work together:
Exit criteria should be observable. Discovery might require a confirmed problem, business impact, and buying process. Proposal might require agreement on scope, commercial owner, and decision timing. Closed-won should reflect a completed commercial commitment, not a verbal promise.
A practical guide to building a sales pipeline can help teams establish the structure, but the analysis only works when representatives use the same definitions. Teams exploring ways to automate Upwork client acquisition can apply the same principle: automate routing and record creation, but keep qualification evidence explicit.
The following video gives teams another visual way to think about stage movement and pipeline structure:
<iframe width="100%" style="aspect-ratio: 16 / 9;" src="https://www.youtube.com/embed/9vnqm1UHC0g" frameborder="0" allow="autoplay; encrypted-media" allowfullscreen></iframe>Sales velocity becomes useful only after it's decomposed. The common formula is:
Number of opportunities × average deal value × win rate ÷ sales-cycle length
The result isn't a trophy number. It's a diagnostic signal. If velocity falls, leaders can ask whether fewer qualified opportunities entered, average value changed, win rate weakened, or cycle length expanded.
Consider two contrasting pipelines. One contains many large opportunities but has aging deals, uncertain close dates, and weak buyer access. The other contains fewer opportunities with clear next steps, engaged stakeholders, and shorter cycles. The first pipeline looks impressive in a board report. The second may produce more dependable revenue because its evidence is stronger.
A stage conversion rate tells the team where opportunities drop. Velocity helps explain the commercial consequence. Slippage adds another layer by showing whether expected close dates survive contact with reality.
Track these measures by month or cohort:
A 2025 study recorded a 22.3% post-implementation sales conversion rate, but that result came from a specific study population and isn't a universal benchmark. Teams should establish their own baseline, change one process variable, and compare results against the prior baseline using the study's reported findings.
A healthy pipeline isn't the largest pipeline. It's the pipeline whose probabilities survive comparison with actual outcomes.
That principle prevents a common mistake: raising activity targets when the issue is poor stage quality. More calls won't repair a proposal stage that lacks decision access. More opportunities won't fix a forecast that includes inactive deals and copied-forward close dates.
A team can use a conversion funnel analysis to connect stage movement with broader funnel behavior. For leaders building a performance decision system, the important design choice is to keep raw pipeline value, evidence-based health, and forecast outcomes visible as separate measures.
The fastest pipeline audit starts with an uncomfortable question: does the company respond to every new inquiry at all? An average response time can look respectable while a large group of leads receives no human follow-up.
An audit of 2,241 U.S. companies found that 37% responded to a web-generated test lead within one hour, 16% responded within one to 24 hours, 24% took more than 24 hours, and 23% never responded, according to the response audit findings. The practical implication is immediate: measure unworked leads before buying more demand.
Add two timestamps to the CRM:
Then report three groups: the percentage with no logged attempt, the percentage contacted after 24 hours, and the percentage contacted within one hour. Those figures reveal whether the first leak is acquisition quality or operational delay.
The five-minute threshold has practical value because same-day reporting can hide the sharpest drop-off. A Harvard Business Review study summarized in lead response research found that companies contacting an online lead within one hour were nearly seven times more likely to achieve a meaningful conversation with a decision-maker than companies waiting an additional hour. The same research reported that companies delaying 24 hours or longer were more than 60 times less likely to qualify the lead than those responding within the first hour.
A useful next-day test routes every form submission to an owner, starts a timer automatically, and escalates when five minutes passes without contact. Review results by 0–5, 5–30, 30–60, and 60+ minutes rather than combining all same-day responses.
| Response Band | Qualification Impact | Action |
|---|---|---|
| 0–5 minutes | Fastest access to the buyer while intent is fresh | Route immediately and escalate at five minutes |
| 5–30 minutes | Early delay may reduce qualification opportunity | Identify queue, ownership, or notification friction |
| 30–60 minutes | Compare decision-maker conversations against faster buckets | Review staffing and handoff timing |
| 60+ minutes | Treat as a separate risk group, not an average | Rework routing, ownership, and escalation |
Response-time analysis must distinguish contact rate, decision-maker conversation rate, and opportunity-creation rate. One source reports that firms responding within five minutes were 100 times more likely to make contact than firms waiting 30 minutes, while the Harvard-linked finding reports 21 times more likely to qualify within five minutes than after 30 minutes. Those events aren't interchangeable, as explained in response-time measurement guidance.
A sales team shouldn't claim faster response increased closed-won revenue when the measured improvement occurred only at contact. A practical sales process automation framework can help enforce timestamps, routing, and escalation without confusing administrative completion with commercial progress.
Most pipeline reports treat an opportunity as one record moving through a linear sequence. That model is convenient, but B2B buying rarely happens through one person. A deal can show the right value, stage, and activity while missing the people who control approval, adoption, procurement, legal review, or internal advocacy.
Recent buyer research indicates that 72% of B2B purchases involve complex, multi-stakeholder buying groups, creating a blind spot when teams forecast from seller activity alone, according to buyer-group research.

A pipeline review should ask which required roles are known, engaged, influential, and progressing. The exact roles vary by business, but a typical enterprise opportunity may require access to:
The analysis can score each role using evidence rather than optimism. Is the person identified? Has that person engaged? Has the relevant buying task been completed? Does an unresolved objection remain? A deal with an active user but no economic buyer should carry a different forecast category from a deal with both roles engaged.
Buying-group coverage becomes useful when it changes stage exit criteria. A proposal shouldn't become forecastable merely because pricing was sent. It may need an identified commercial approver, a confirmed decision process, and a documented path through procurement. A late-stage opportunity without those signals belongs in a risk category even if the representative has logged frequent activity.
This approach also changes prioritization. Adding more leads or increasing pipeline coverage won't necessarily improve predictability if the same incomplete buying groups continue entering the funnel. The bottleneck may be stakeholder progression, not volume.
A marketing reporting dashboard framework can connect account engagement with stakeholder progression, but the operating rule remains human: representatives need to record who matters, what each person needs, and which objection blocks the next decision.
The CRM starts measuring a buyer after the buyer becomes visible. That timing creates a serious blind spot. Available research indicates that sellers receive only 17% of a buyer's total time during the sales cycle, leaving 83% outside direct seller interaction, while other reporting places independent buyer research at roughly two-thirds of the journey, according to buyer behavior research.
A newly created opportunity may have been researching for months. An early-stage record with limited logged activity may already understand the problem, compare alternatives, and be close to a decision. Stage age alone can't distinguish those situations.
The useful dashboard combines account-level signals with CRM evidence. Relevant signals can include:
These signals shouldn't be converted into false precision. A scoring model can identify accounts that deserve attention, but it can't prove budget, authority, or timing without human validation. The dashboard should show known evidence, missing evidence, and contradictory evidence separately.
Absence of CRM activity isn't proof of absent interest. It may mean the buyer hasn't identified themselves yet.
The practical design is a two-layer view. The first layer reports stage progression, opportunity age, and forecast category. The second reports account engagement before opportunity creation and highlights accounts with substantial activity but no visible owner. Sales and marketing can then decide whether to create outreach, offer relevant education, or wait for a stronger buying signal.
This makes stage velocity a lagging indicator rather than the sole measure of momentum. The pre-pipeline layer helps teams find hidden demand and distinguish a truly cold account from one that has not yet entered the seller's view.
Pipeline analysis only creates value when findings become decisions. A team can turn each leakage point into an experiment backlog, then score opportunities by expected impact on the bottleneck, confidence in the diagnosis, and effort to run.
Start with one bottleneck. If unworked leads represent the clearest loss, fixing routing should come before increasing acquisition. If response is fast but decision-maker conversations remain weak, the next experiment may involve qualification and messaging rather than speed.
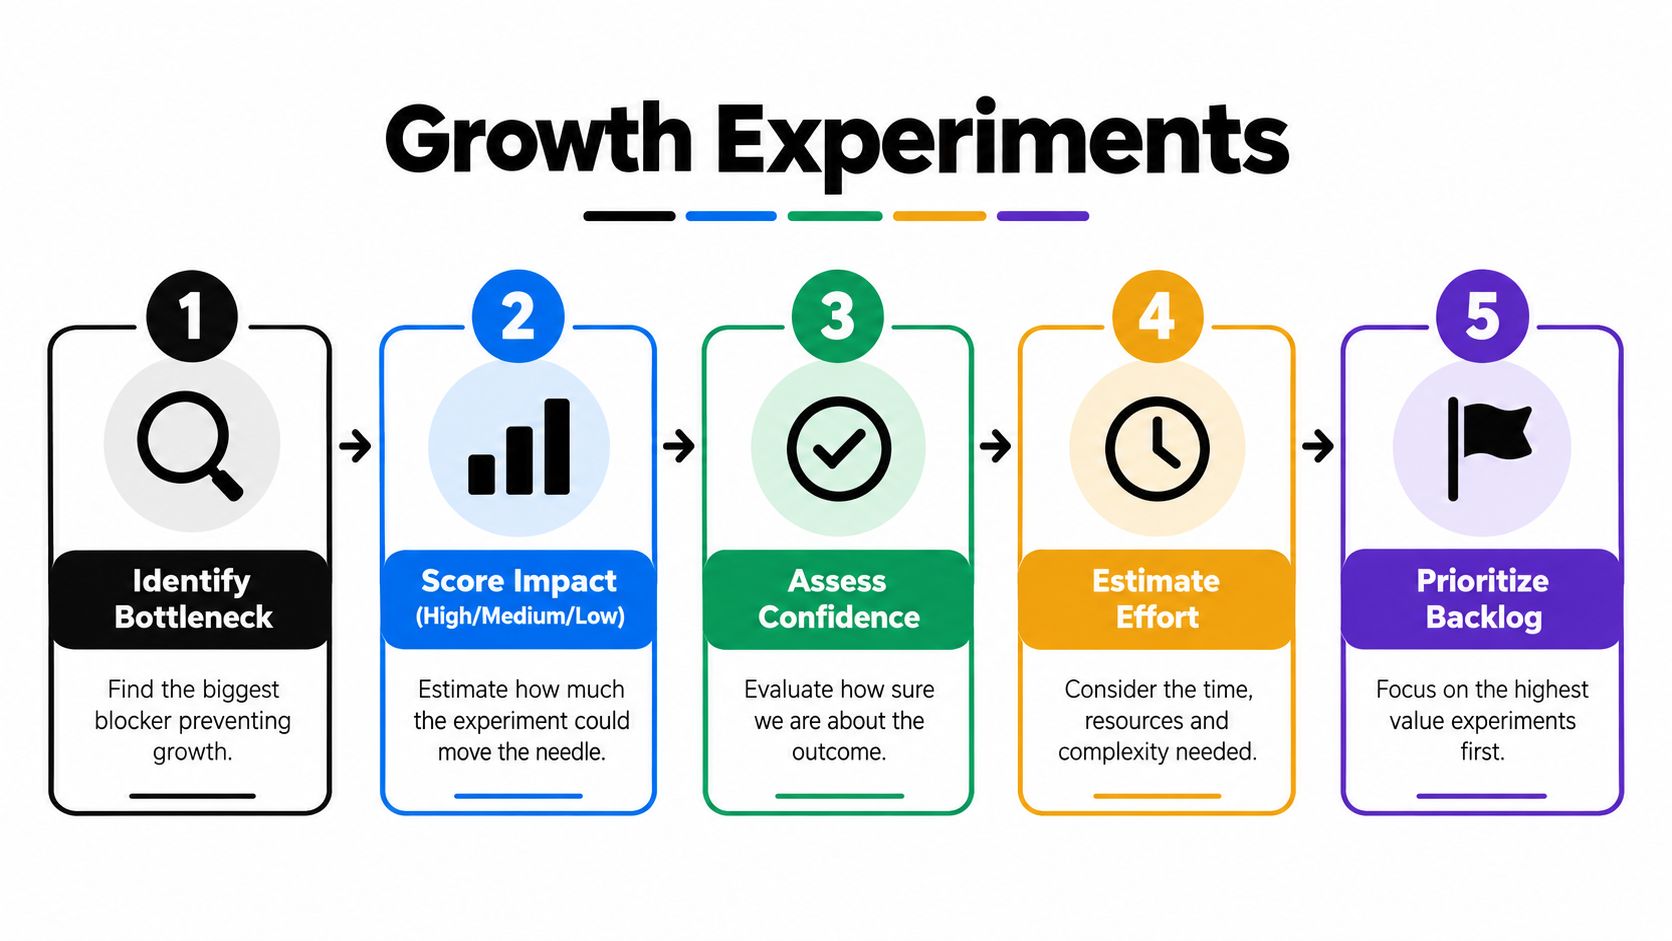
A practical backlog might contain these candidates:
Define the baseline before changing the process. Run one experiment against one bottleneck, then compare stage conversion, opportunity creation, slippage, and forecast variance. Activity volume can be included as context, but it shouldn't be the success measure.
The Monday checklist is simple:
Predictable revenue rarely comes from adding volume to a leaky system. It comes from finding the constraint, testing a focused fix, and measuring whether buyer progress and forecast outcomes actually improve.
Sprints & Sneakers helps B2B teams audit funnel progression, diagnose conversion bottlenecks, connect marketing automation with pipeline data, and prioritize AI-powered growth experiments. Visit Sprints & Sneakers to turn pipeline findings into a focused plan for measurable growth.
Growth marketing, AI and automation, SEO, performance marketing, retention strategies, and sustainable business practices.
Weekly. Subscribe to our newsletter to get new articles straight to your inbox.
Absolutely. Everything we publish is designed to be actionable. Take it, test it, and make it your own.
Yes. We publish experiments with real numbers. What worked, what didn't, and what we learned.
Our growth team — strategists, performance marketers, data specialists, and AI builders who work on client campaigns every day.
We're open to it. Reach out via our contact page with your topic and we'll take a look.