
Content Distribution Strategy for Pipeline Growth
Build a content distribution strategy that turns one asset into pipeline, with channel scores, repurposing steps, and KPIs.
A channel plan that pastes the same link everywhere and counts impressions can make distribution look busy while qualified pipeline stays thin. A content distribution strategy assigns each asset to a buying role, a native format, and a commercial outcome. AI summaries can increase visibility while reducing the click, so clicks alone cannot carry the scorecard.
Write one success sentence before choosing channels: a mid-market operations guide should create sales-qualified opportunities within 90 days. Include the buying motion, because an ecommerce purchase and a multi-month B2B deal need different channel mixes.
Keep the site and email list as home base. Use search, social, partners, and events for discovery or trust, then tailor the hook and ask for the economic buyer, technical evaluator, and end user.
Table of Contents
- Why Reach Alone Stops Paying Off
- The Channel Portfolio You Can Fill Tomorrow
- Score Channels on Fit Before Budget
- Measure Pipeline Not Vanity Metrics
- How to Amplify and Repurpose One Asset
- Distribution Brief Template and Tagging Checklist
- Set the Cadence and Start the Next Sprint
Why Reach Alone Stops Paying Off
AI summaries can raise a page's visibility while reducing the click-through that older SEO plans counted as success. Search visibility and site visits have split.
Ahrefs, using 300,000 keywords and aggregated Search Console data, found that keywords displaying AI Overviews correlated with a 58% lower average click-through rate for the top-ranking page in December 2025 than keywords without them. Authoritas research reported a 47.5% drop in desktop click-through rate when AI summaries appeared. A page can be easier to find and still fail the old SEO scorecard.

Write one pipeline sentence first
Set the commercial job before choosing channels. A sales lead should be able to accept the sentence as a useful outcome, not a marketing activity.
A mid-market ops guide should create sales-qualified opportunities within 90 days, from evaluators who compare vendors alone and from buyers who only show up when cost is on the table.
Rankings and sessions are inputs; sales-qualified opportunities are the goal. Citations and branded search still matter as assisted signals, but they do not replace clicks, meetings, or opportunities. If demos stall, a citation alone has not done the job.
Split the room before you split the channels
Three people in one account can need three different messages and asks.
- Economic buyer: Lead with cost, risk, and timing. Use a short post that names the budget problem instead of touring features.
- Technical evaluator: Show method, integration, and proof. Build a page for the comparison query, with a direct opening that answer engines can quote.
- End user: Address the daily job with a checklist or short clip they can forward inside the account.
A consumer brand with a short cycle may have one person acting as both buyer and user. An industrial team selling over several months needs to keep those roles distinct. Match the format and call to action to the role, then judge the distribution by qualified opportunities rather than impressions.
Open public pages with a direct answer, then support each subheading with one clear claim. State the source and date beside each number so a quoted answer retains its context. Keep the pipeline sentence in view when reviewing results.
The Channel Portfolio You Can Fill Tomorrow
Usage is not the same as a job. Fill this table first, then decide what stays live.
| Channel | Used by | Rated better results | Primary job | Native format |
|---|---|---|---|---|
| Organic social | 90% | 44% | Discovery and recall | Short native posts, not link dumps |
| Blogs and SEO pages | 79% | 40% | Search discovery and citations | One clear page per query |
| Email newsletters | 73% | 39% | Nurture between buys | Digest with a single featured asset |
| Webinars | 56% | 51% | High-intent conversion | Live session plus a replay clip |
| In-person events | 56% | 56% | Trust with named accounts | Talk, then a follow-up asset |
Those rows come from the CMI and MarketingProfs global July 2023 survey of 1,080 marketers. Organic social was used by 90%, blogs by 79%, email newsletters by 73%, and webinars and in-person events by 56% each. Perceived better results flipped the ranking. In-person events produced better results for 56% of marketers and webinars for 51%, against 44% for email and for organic social, 40% for blogs, and 39% for newsletters. Read the email row and the newsletter row apart. Email as a broader category was rated better by 44%, while the newsletter format sat at 39%.
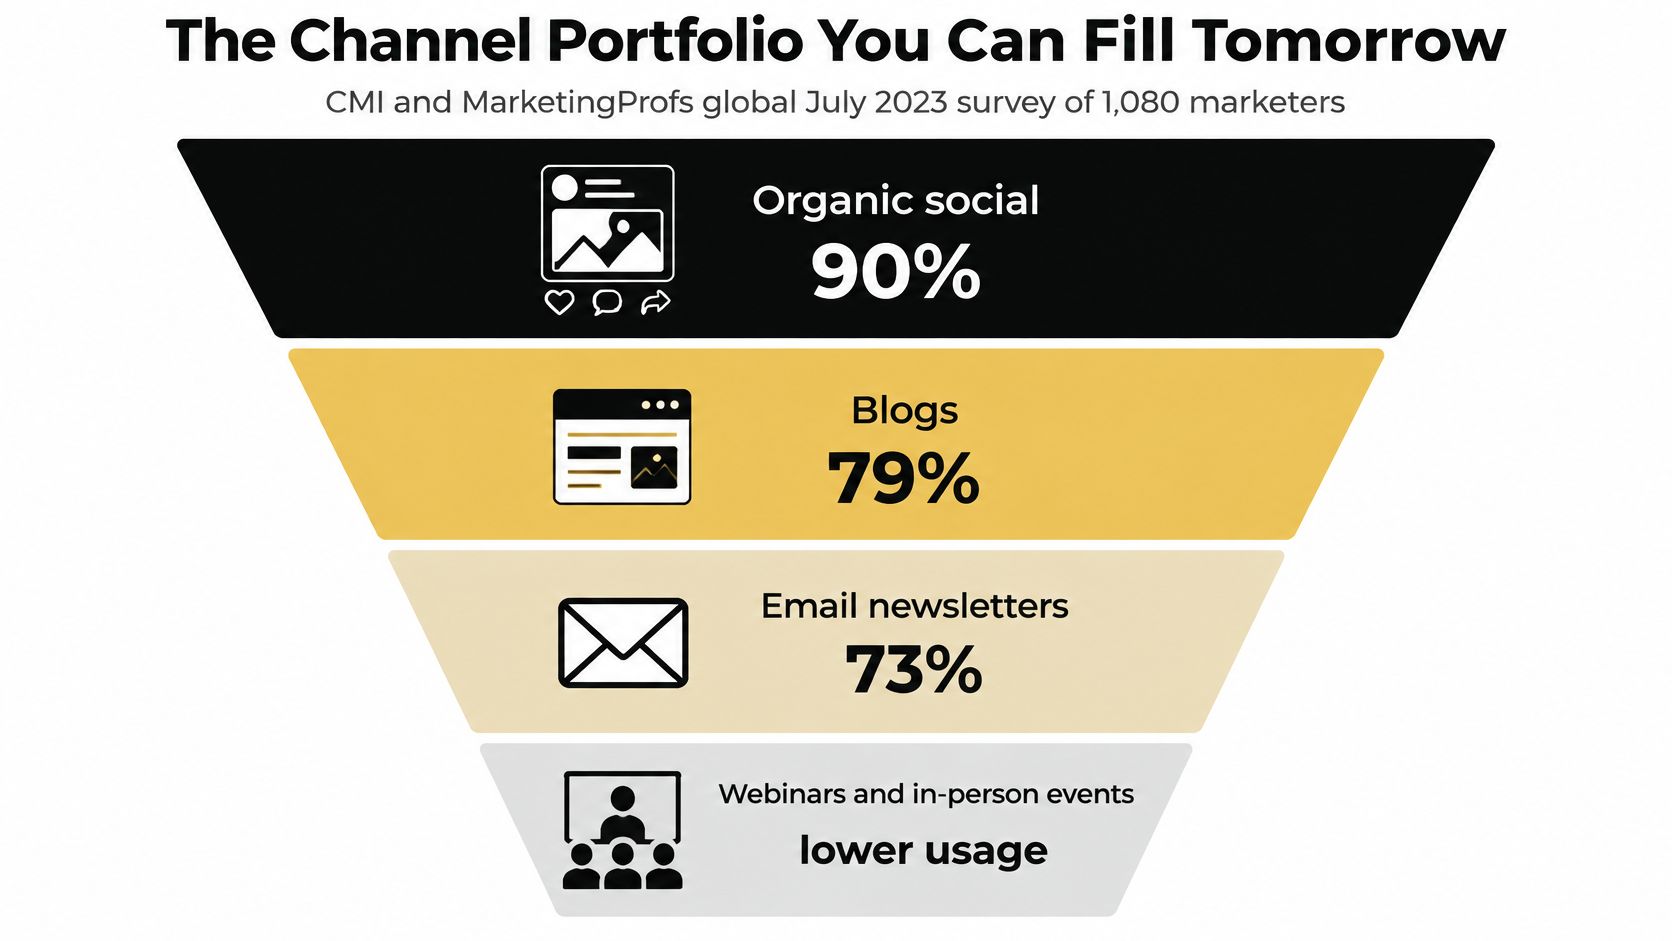
The same survey put conversions as the most-used performance metric at 73%, with email engagement and website traffic at 71% each. Traffic can sit on the dashboard. It cannot be the only row that decides budget.
Jobs, not a popularity contest
Search and social discover. Email repeats the asset between buying moments. Webinars and events convert a named account because the whole committee can sit in one room.
Say a SaaS team has one technical guide for a buying committee.
- Evaluator: The guide becomes a search page with one query, one method, and a path to a fit call.
- Economic buyer: A LinkedIn post names the cost problem and does not dump the URL in the first line.
- Committee: A webinar walks the trade-off live, then sales sends a one-page leave-behind the same day.
- Open opportunities: A newsletter features that single asset, with one click, not five competing links.
A consumer brand swaps the webinar row for creator short-form and keeps email for repeat purchase. The blank column still has a rule. Every live asset gets one primary job, one owner, and a conversion path tagged before publish. Do not paste the same creative into every row.
High adoption is not a reason to keep a channel that never creates a qualified conversation. If organic social is in the plan only because 90% of marketers use it, cut it until a named segment replies.
Independent operators can borrow the same job split from distribution frameworks for independent writers, then map each format to a funnel stage instead of a follower count. Teams that already run several channels should read how cross-channel marketing ties those jobs to one measurement window, so a webinar is not judged only on the last click.
Score Channels on Fit Before Budget
Score each candidate in an hour on three 1-to-5 scales: audience fit, pipeline impact, and effort, where 5 means light work. Multiply fit by impact to rank channels. Treat effort as a constraint: review any channel scored 1 or 2, and keep it only if sales or a partner already owns the room.
| Channel | Audience fit | Pipeline impact | Effort (5 = easy) |
|---|---|---|---|
| LinkedIn, problem-led posts | 5 | 4 | 4 |
| SEO page for the evaluator query | 4 | 4 | 3 |
| Webinar with sales in the room | 4 | 5 | 2 |
| Customer email to open opportunities | 5 | 4 | 5 |
| Partner newsletter mention | 3 | 3 | 4 |
| TikTok or short-form consumer video | 1 | 1 | 2 |
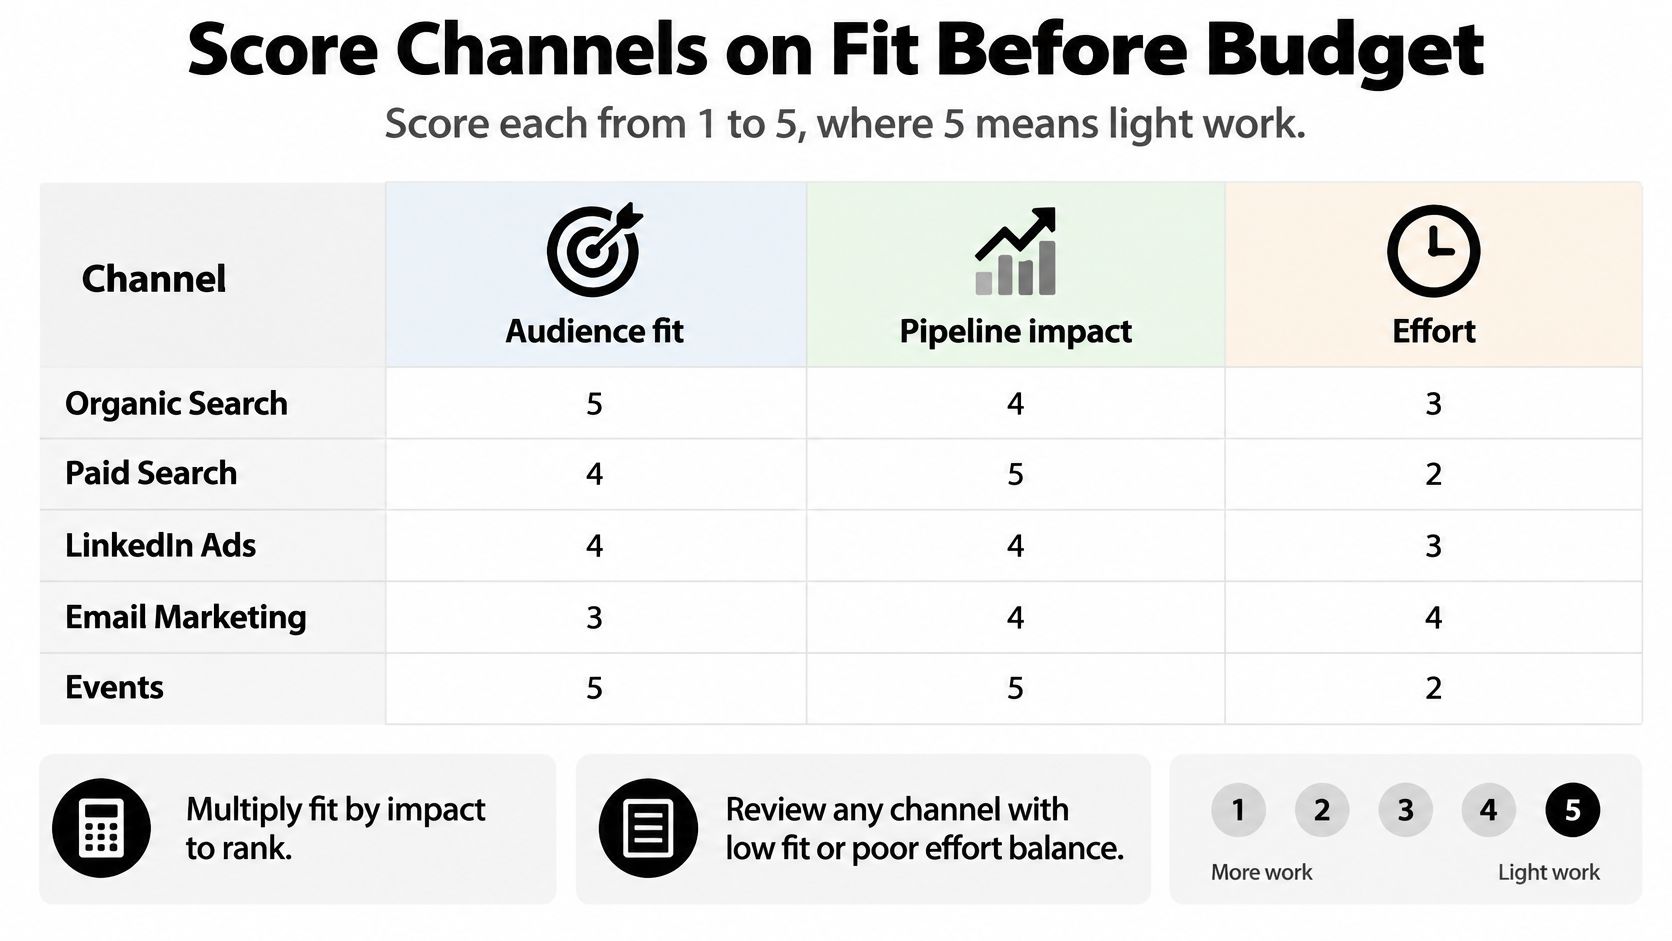
For this mid-market B2B SaaS segment, LinkedIn problem-led posts, the webinar, and customer email tie at 20 for fit times impact. Use sales ownership and effort to break the tie: the webinar has sales in the room but takes more work, while customer email is the easiest route into open opportunities. The evaluator SEO page scores 16, making it a strong fit when buyers are comparing options independently.
Pew Research Center reported that 76% of Americans ages 18–29 received news from social media at least sometimes, versus 28% of adults 65 and older. Among younger adults, 43% received news from TikTok, compared with 3% of adults 65 and older. These figures describe news use, not buying behavior. Treat them as audience-fit context, then judge channels by the buying roles and qualified pipeline they reach.
Raise TikTok and Instagram to fit 5 and impact 4 when the audience is a consumer market. Lower the webinar to fit 2 and impact 2 if a live committee discussion does not match how those buyers decide.
Choose a webinar over another social post when a deal needs the buying committee together. Keep search for evaluators comparing vendors on their own. Treat performance media as a paid distribution option only when the segment and expected pipeline outcome are clear. AI summaries can increase visibility while reducing clicks, so score the channel on qualified conversations, not the click alone. Circle the top two channels for the next asset and park the rest.
Measure Pipeline Not Vanity Metrics
A channel can win the click and still lose the deal. Measure whether each asset moves the right buying role toward a qualified opportunity, especially as AI summaries make search visibility less dependent on a click. Start with one segment and one hypothesis. For example, test whether a problem-led LinkedIn asset paired with a gated technical guide creates more sales-qualified demand than organic search alone. Set a control, keep attribution rules consistent, and allow four to six weeks for the test. A handful of clicks from one week cannot settle it.
Directional benchmarks, not targets
Use these figures as a reference beside internal measures for reach, engaged visits, qualified conversions, pipeline influence, and revenue. The benchmarks vary by audience, offer, geography, brand strength, and tracking.
| Channel | Visitor to lead | MQL to SQL | What to optimize |
|---|---|---|---|
| 2.2% | No benchmark published; compare SQL rate with your own baseline | Sales-qualified demand from one segment | |
| SEO | 2.1% | 51% | Qualified visits that progress |
| 1.3% | 46% | Unique clicks that lead to opportunities | |
| Webinars | 0.9% | No benchmark published; compare attendee-to-SQL rate with your own baseline | Attendees who reach sales |
| PPC | 0.7% | 26% | Pipeline cost, not click volume |
A compiled B2B benchmark reports visitor-to-lead rates of 2.2% for LinkedIn, 2.1% for SEO, 1.3% for email, 0.9% for webinars, and 0.7% for PPC. It reports MQL-to-SQL conversion of 51% for SEO, 46% for email, and 26% for PPC. If an SEO page attracts visitors but few become SQLs, check whether the query matches the offer before calling the channel weak.
Four numbers that replace the traffic chart
For a scale-up, track SQL rate, opportunities created, pipeline velocity, and revenue per asset. These measures connect distribution to buying progress instead of treating traffic as the outcome.
Separate assisted conversions from last touch so a webinar is not penalized when search gets the final click. Exclude view-through conversions from double-counting, tag every touch with consistent campaign parameters before launch, and use one attribution window to read stage progression. Cross-channel attribution helps distinguish a discovery touch from the interaction that moves a deal forward.
A send to 10,000 recipients means little if unique clicks and the next action do not move. Opens alone, especially in privacy-inflated inboxes, do not prove an asset worked. Strong delivery with weak clicks points to the offer or ask; weak progress after the click points to the landing path. Compare qualified-pipeline cost and stage progression on consistent terms before reallocating budget.
Three patterns can make a dashboard look healthier than the pipeline:
- Tiny samples: Shifting budget after a dozen leads creates a weak comparison. Wait through the observation window.
- Volume mistaken for quality: More form fills alongside a falling SQL rate means the added leads are not advancing.
- Search traffic without clicks: Sessions can rise while fewer people click from search. Track the opportunities that still enter the pipeline.
How to Amplify and Repurpose One Asset
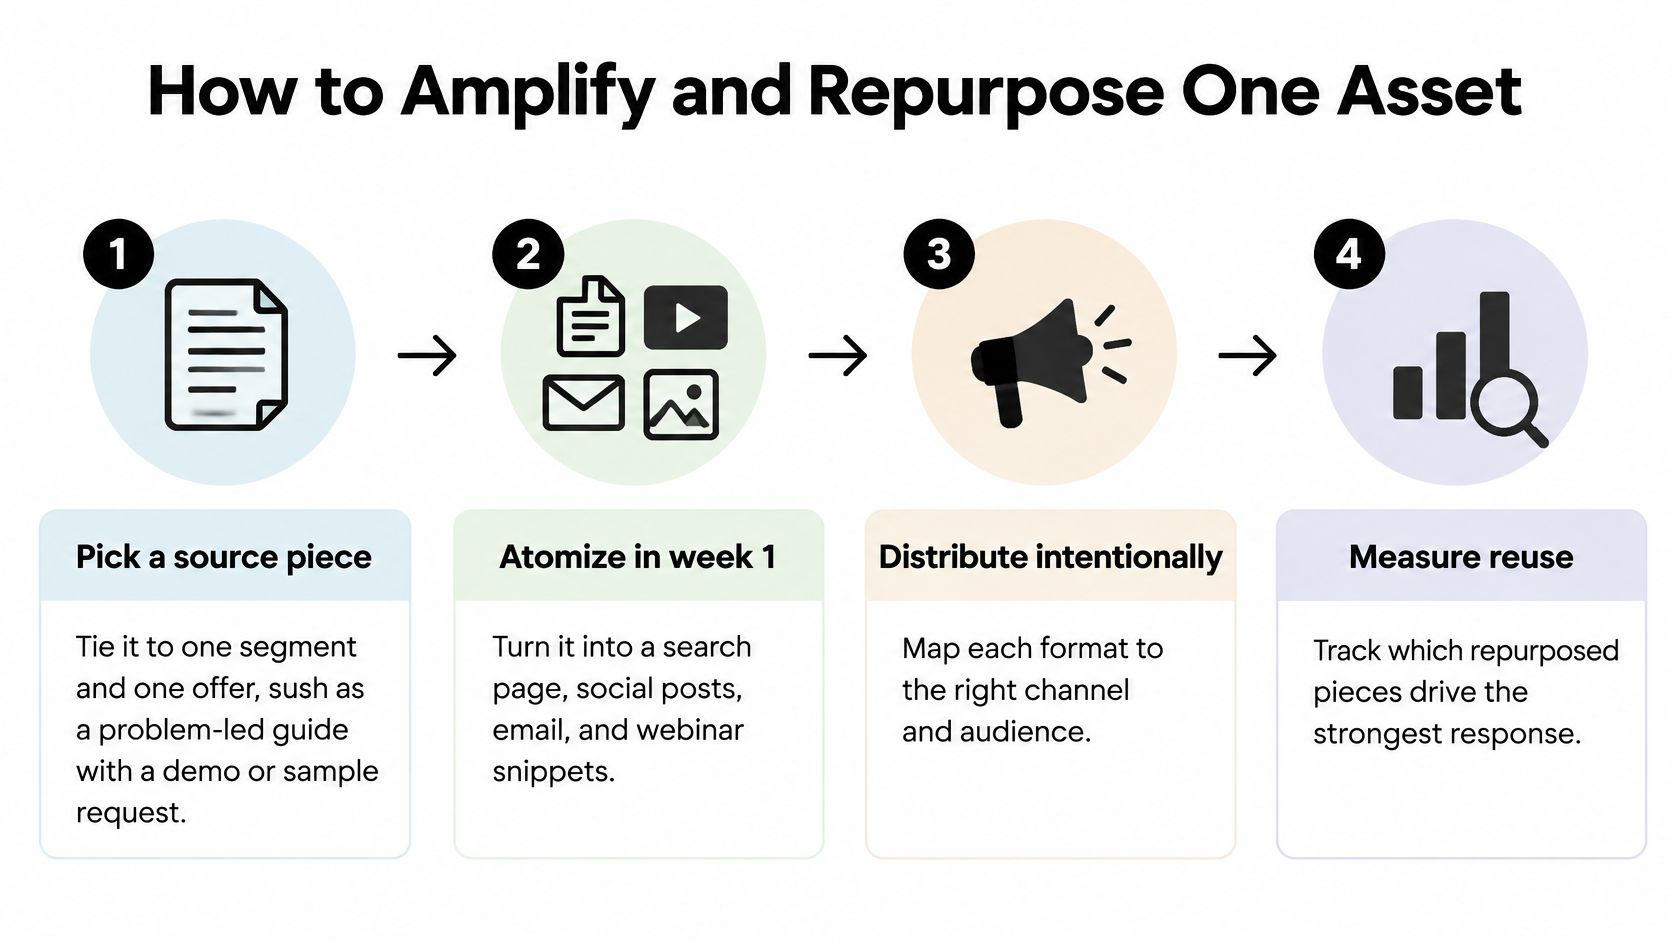
Run one asset, not the library. Fill one row of the brief in the next pass before any copy is drafted, so every format already has its segment, job, and tagged link.
The three-week sprint
- Pick the source piece. Tie it to one segment and one offer, such as a problem-led guide with a demo or a sample request. If the offer is fuzzy, stop. Six formats will not rescue a vague ask.
- Atomize in week 1. Turn the source into a search page, five native social posts, one email module, a sales snippet, a 15-second clip, and a partner blurb. For a consumer catalog, a tight AI listicle builder for DTC brands can draft the comparison rows, then a human rewrites the hook so it matches the offer.
- Rewrite the hook and the ask per row. The buyer post names cost. The evaluator page names the method. The email asks for one click. The sales snippet answers the objection heard on the last call. Same facts, different job. Content built for leads fails when every derivative keeps the homepage call to action.
- Ship organic and owned in week 2. That includes the newsletter and a customer or partner co-publish if a name is already warm. Cold partner blasts wait.
- Add paid only in week 3, and only on the post that already earned replies or saves. In 2025, 84% of B2B marketers used paid channels to distribute content, and 73% of those used social media advertising or promoted posts, according to the Content Marketing Institute. Paid is normal. It is not a strategy by itself. Cap the test to one audience and one creative.
- Tag every link the same way, and hand sales the snippet the same day the public post ships. Judge the email the next morning on unique clicks and the meeting or demo that follows, not on opens.
One asset, six formats, one offer.
Sprints & Sneakers is one agency that assigns distribution channels before production and adapts format to the buying stage, which matches this sprint. The point is the sequence, not the vendor. If week 3 paid starts before week 1 has a tagged path, you bought noise.
Distribution Brief Template and Tagging Checklist
Fill one row per asset before any copy is drafted. Nine fields stop a "quick post" from shipping without an owner.
| Field | What to write | Worked example |
|---|---|---|
| Source asset and one offer | The piece plus the single commercial ask | Vendor consolidation guide, offer is a fit call |
| Segment and buying role | Who, and whether they buy, evaluate, or use | Mid-market operations leads acting as technical evaluators |
| Funnel job | Discover, evaluate, or convert | Evaluate |
| Primary channel and native format | One row from the portfolio | SEO page, one clear page per query |
| Hook and ask for that row | The line they see, and the action | Method comparison, book a 20-minute fit call |
| Conversion path that counts | The page and the event, not a vibe | Organic visit to booked call |
| Hypothesis and control | Copied from the test design | Guide plus call versus the existing comparison page alone |
| Success metric and kill line | The number, the window, and when you stop | SQL rate from organic visits over 4 to 6 weeks, stop if below control |
| Owner, ship date, review date | Named people and dates | Strategist ships Monday, commercial owner reviews in week 6 |
Tagging checklist
Use the same four keys on every link: utm_source, utm_medium, utm_campaign, utm_content. Name each campaign once, in lowercase, with a quarter tag such as q3-vendor-consolidation. Confirm every link lands on the tracked page before publish. Send the sales snippet to the CRM the same day the public post ships.
Skip a field and the asset will still go out. It just will not be comparable to the control, which means the next budget meeting is a taste test.
Set the Cadence and Start the Next Sprint
Four owners keep the system small enough to run.
- Strategist: Picks the asset and the segment.
- Creator: Atomizes the formats and rewrites each hook.
- Distributor: Ships and tags every link.
- Commercial owner: Usually sales or lifecycle, and confirms each opportunity is real.
Meet 30 minutes every two weeks. Read SQL rate, opportunities created, and revenue per asset. Hold a monthly reallocation where a channel must earn its next sprint. Use the kill rules already set: comparable pipeline cost, stage progression, and no shifts on a tiny sample.
The next 90 days
Days 1 to 30 fill the portfolio table and the scores for one asset, then ship the organic cuts. Days 31 to 60 run one paid or partner test with frozen attribution. Days 61 to 90 compare qualified-pipeline cost and decide keep, fix, or stop. Marketing experiments only teach something when that freeze holds.
Governance is short. Every number carries a source and a date. Customer proof has written approval. No claim reaches a channel without its brief row.
Distribute fewer assets, to the people who can buy, and keep only what moves a stage. This week, score two channels and atomize one asset already on the site.
Sprints & Sneakers builds full-funnel growth systems for B2B and B2C teams that need pipeline, not another content calendar. The work starts with a growth scan that finds the bottleneck, then runs experiments across awareness, acquisition, activation, revenue, retention, and referral so distribution is tied to opportunities. Visit Sprints & Sneakers to talk through the next stage of that system.
Related articles
Frequently asked questions
Growth marketing, AI and automation, SEO, performance marketing, retention strategies, and sustainable business practices.
Weekly. Subscribe to our newsletter to get new articles straight to your inbox.
Absolutely. Everything we publish is designed to be actionable. Take it, test it, and make it your own.
Yes. We publish experiments with real numbers. What worked, what didn't, and what we learned.
Our growth team — strategists, performance marketers, data specialists, and AI builders who work on client campaigns every day.
We're open to it. Reach out via our contact page with your topic and we'll take a look.