

Master customer lifetime value analysis with proven formulas, cohort models, and step-by-step guidance to grow predictable B2B and B2C revenue.
The most popular advice about customer lifetime value is also the most dangerous: take average revenue per customer and multiply it by an assumed lifespan. That shortcut looks clean in a growth review, but it can hide shrinking margins, one-time buyers, expensive support, refunds, and cohorts that churn before the model expects them to.
A useful customer lifetime value analysis is less like a single KPI and more like an operating system for growth. It shows which customers create profit, which acquisition sources produce durable relationships, and where retention, frequency, order value, or margin can compound. The strongest teams don't wait for a perfect data science project. They build a trusted baseline, segment it by cohort, validate the forecast against real outcomes, and improve the model while the business keeps moving.
Revenue CLV answers one question, how much money a customer may generate. Profit-adjusted CLV answers the question a board actually cares about, how much value remains after the variable costs of delivering and supporting that relationship.
That distinction changes decisions. A customer with high order value may also generate costly returns or require heavy support. A subscription account with attractive recurring revenue may become unprofitable when usage, infrastructure, payment failures, and servicing effort rise. Treating both customers as equal because their revenue looks similar turns acquisition reporting into spreadsheet theater.
Customer lifetime value emerged as a formal marketing and finance concept during the 1990s and early 2000s, when researchers framed it as the present value of expected benefits from a customer relationship, less acquisition, servicing, and communication costs, discounted over time. The early literature connected CLV directly to discounted cash flow logic and later developed three major research streams, model development, customer base analysis, and analytical applications in marketing strategy. The historical review of CLV research also established customer equity as the combined lifetime value of a company's customer base.
That history matters because CLV was never intended to be a decorative revenue average. It was designed to guide acquisition, retention, and resource allocation. A mature analysis therefore separates customers by acquisition channel, first purchase or plan, market segment, and cohort date. Blended averages can make a weak new channel look healthy because older, stronger cohorts carry the result.
Practical rule: If finance can't trace a CLV number back to a cohort, margin assumption, and cash-flow horizon, the number isn't ready to guide budget allocation.
The practical sequence is straightforward:
This approach turns CLV into a decision system that can mature in weeks rather than quarters. The formula matters, but the discipline matters more, especially when marketing, finance, sales, and customer success use the same definition of value.
A non-analyst can calculate a useful starting point with three inputs:
CLV = Average Order Value × Purchase Frequency × Customer Lifespan
IBM's coffee-shop example uses a USD 5 average sale, 100 annual visits, and a 5-year lifespan, producing a CLV of USD 2,500. The same source gives a subscription example of USD 20 per month for 4 years, producing USD 960. IBM's customer lifetime value guide shows the arithmetic clearly.
That formula estimates revenue, not profit. To make it operational, multiply the result by contribution or gross margin, then subtract acquisition and retention costs where the decision requires net value. For longer relationships, discount future contribution margins using the company's cost of capital or another approved discount rate. A future cash flow shouldn't carry the same weight as an immediate one.
For recurring revenue, the widely used operational form is:
CLV ≈ ARPA × Gross Margin ÷ Churn Rate
Twilio presents this recurring-revenue framing and a more advanced discounted version that subtracts acquisition cost. Twilio's CLV formula guide is useful when comparing subscription cohorts or paid channels.
The shortcut works best when renewals are predictable, churn is measured consistently, and margin doesn't vary dramatically by account. It breaks when expansion, contraction, annual prepayment, downgrades, implementation costs, or customer-specific service loads materially change the cash-flow pattern. A SaaS team with usage-based pricing should model account-level margin rather than rely on one blended ARPA.
For non-contractual commerce, lifespan is probabilistic. A customer who hasn't purchased recently may return, so a simple average can misclassify active customers as churned or inflate value by focusing only on survivors.
Suppose a subscription box team has a recurring plan with stable monthly revenue, a known gross margin, and measured monthly churn. The analyst can calculate a quick revenue estimate with ARPA divided by churn, convert it to contribution with gross margin, and then build a discounted cohort model that includes acquisition cost and monthly cash-flow timing.
The three outputs shouldn't be forced to match. The shortcut is useful for directional planning, the margin-adjusted version supports unit economics, and the discounted cohort model belongs in a serious investment case. Teams looking for category context can also review retention benchmarks for ecommerce, while keeping internal cohorts as the primary reference point.
| Formula | Best For | Key Limitation |
|---|---|---|
| AOV × frequency × lifespan | Fast e-commerce or repeat-purchase estimate | Depends heavily on an assumed lifespan and ignores margin |
| ARPA × gross margin ÷ churn | Contractual subscription businesses | Weak when expansion, variable margin, or churn timing varies |
| Discounted contribution-margin projection | Board planning and channel investment | Requires reliable cohort, cost, retention, and discount assumptions |
Bloomreach decomposes CLV into four practical levers: average order value, purchase frequency, gross margin, and churn rate. Its worked example uses an AOV of 25, frequency of 2.67, gross margin of 0.41, and churn of 60%, producing a CLV of 45.7. The Bloomreach CLV guide makes the operating logic visible instead of treating CLV as a black box.
Acquisition quality belongs beside those four levers, even though it isn't a direct multiplier in the formula. A channel that brings customers with stronger retention and margin creates a better starting distribution than a channel optimized only for cheap conversions.
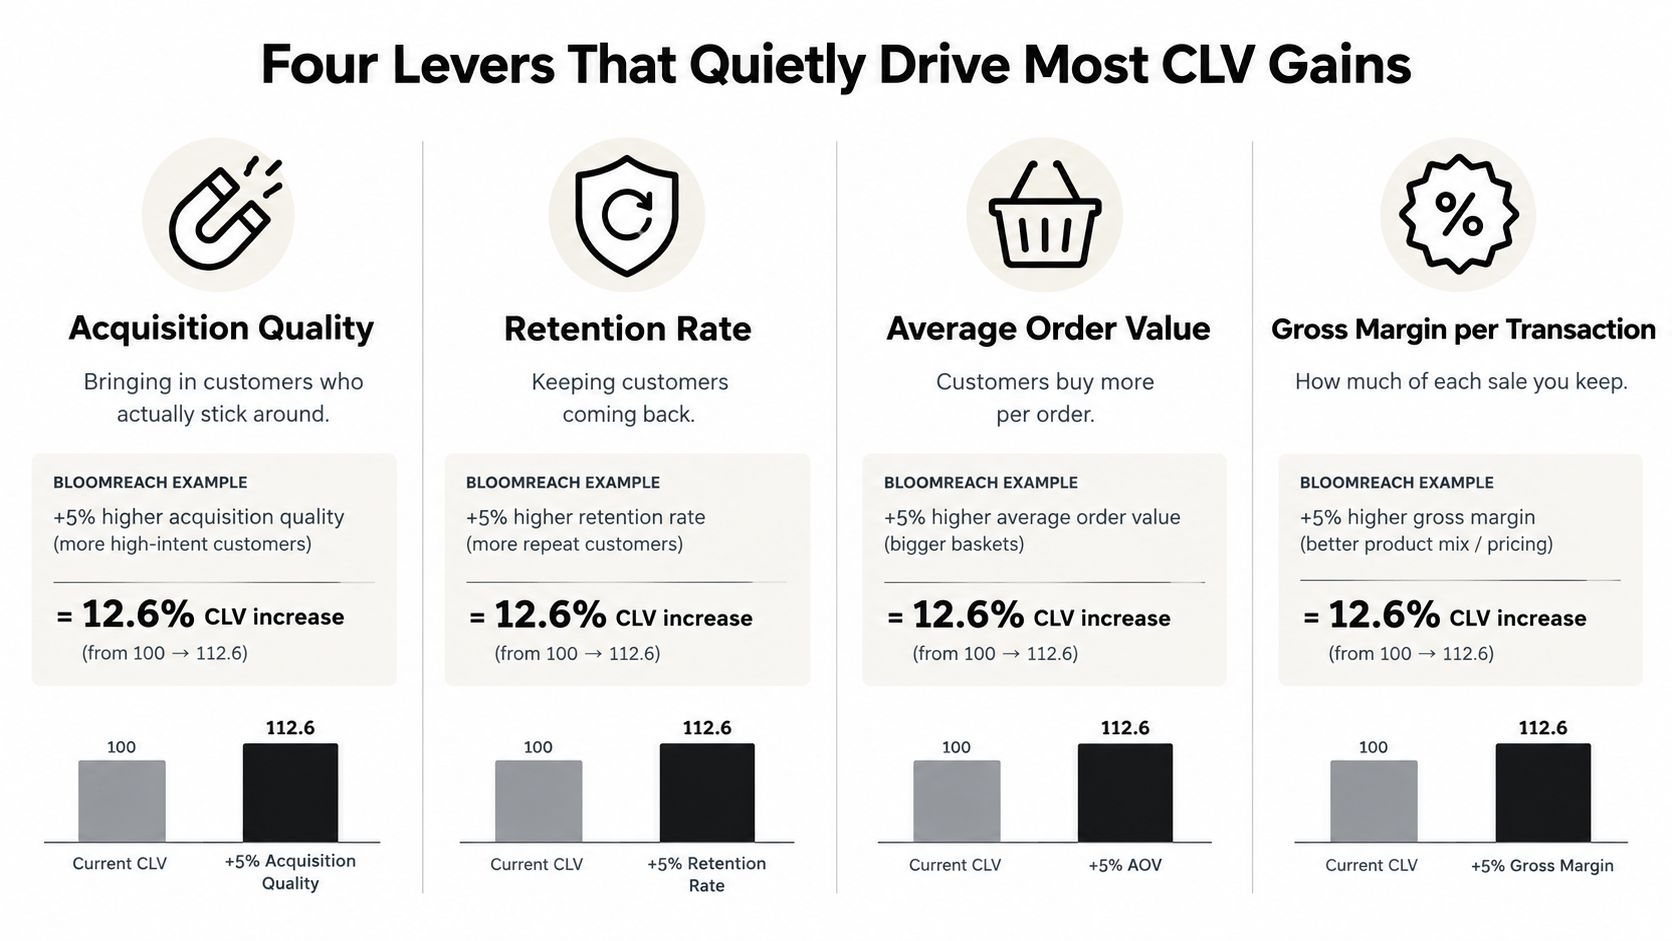
Retention multiplies every future purchase and every future margin contribution. If retention improves from 80% to 85%, average lifespan extends from 5 years to 6.7 years, a 34% increase, according to the supplied CLV research summary. The source discussion of retention and CLV drivers explains why retention operates differently from a one-time price or frequency change.
A 5% increase in price can lift revenue per transaction, but it won't create value if the price change causes customers to leave sooner. Frequency can be powerful for replenishment businesses, while acquisition quality matters most when a team is opening a new channel. Margin becomes the priority when fulfillment, discounts, payment fees, or support absorb too much of each sale.
Teams tend to optimize the loudest lever. Paid media gets attention because spend is visible, while margin leakage and second-purchase failure sit in less visible systems. A practical framework for increasing customer lifetime value helps connect the lever to a measurable experiment, a control group, and an owner.
A spreadsheet can establish the baseline. It shouldn't become the permanent forecasting engine once cohorts, channels, and product lines behave differently.
The first useful build is a monthly cohort table. For each customer or account, store the cohort month, first order or activation date, monthly activity, revenue, variable cost, and acquisition source. Then calculate active retention and cumulative contribution per cohort. A compact SQL pattern looks like this:
select
 date_trunc('month', first_order_date) as cohort_month,
 date_diff('month', first_order_date, order_date) as months_since_start,
 count(distinct customer_id) as active_customers,
 sum(net_revenue - variable_costs) as contribution_margin
from customer_orders
group by 1, 2;
The exact syntax changes by warehouse, but the logic should remain reproducible. Marketing needs the cohort curve, finance needs contribution, and growth needs the ability to compare a forecast with what later happened.
For repeat-purchase commerce, a probabilistic model such as BG/NBD with Gamma-Gamma can estimate the probability that a customer remains active and the value of expected future purchases. A Python workflow can fit those models from transaction frequency, recency, and monetary value. When transaction volume is thin, a simpler regression using recency, frequency, first order value, category, channel, and early engagement often makes a more defensible fallback.
The model should be tested against a held-out cohort, not judged by how well it explains the data used to train it. If monthly repeat rate falls below 10%, according to the supplied modeling guidance, projections become especially sensitive to sparse observations, seasonality, and the definition of an active customer. The CLV modeling framework also recommends retention and projected margin time series instead of one average lifespan and one average margin.
Model discipline: A less sophisticated forecast that survives a cohort holdout is more valuable than an advanced model that only fits historical survivors.
A team is ready to move from spreadsheets to code when:
| Model | Data Required | Strength | Watch Out For |
|---|---|---|---|
| Historical cohort table | Orders or subscriptions, dates, customer IDs, margin | Transparent and easy to audit | Describes the past and may understate future activity |
| BG/NBD plus Gamma-Gamma | Transaction-level recency, frequency, and monetary data | Handles non-contractual repeat behavior probabilistically | Sparse data, zero inflation, and seasonality can distort fit |
| Regression fallback | Customer features and a future-value target | Practical when transaction volume is limited | Feature leakage and unstable relationships |
| Dynamic production model | Cohorts, behavior, cost, retention, and refresh process | Updates decisions as customer signals change | Requires monitoring, governance, and clear ownership |
A useful marketing analytics dashboard should expose predictions, realized contribution, cohort retention, and model error together. A score without its validation trail invites overconfidence.
The formula is rarely the bottleneck. The hard work is deciding whether the customer who bought through an ad, opened a support ticket, received a refund, and renewed through billing is represented as one customer everywhere.
A dependable pipeline starts with four source groups:
Every event needs a durable customer or account key and a reliable timestamp. The warehouse should store first-order date, signup date, activation date, renewal date, cancellation date, and cohort label in consistent fields. Guest purchases, duplicate contacts, merged accounts, and multi-seat B2B relationships need explicit identity rules rather than manual fixes.
Incremental staging tables keep the analysis reproducible. A refund should reduce contribution in the correct cohort, a contract adjustment should affect the right account period, and delayed advertising data shouldn't alter a board report after the meeting without notice.
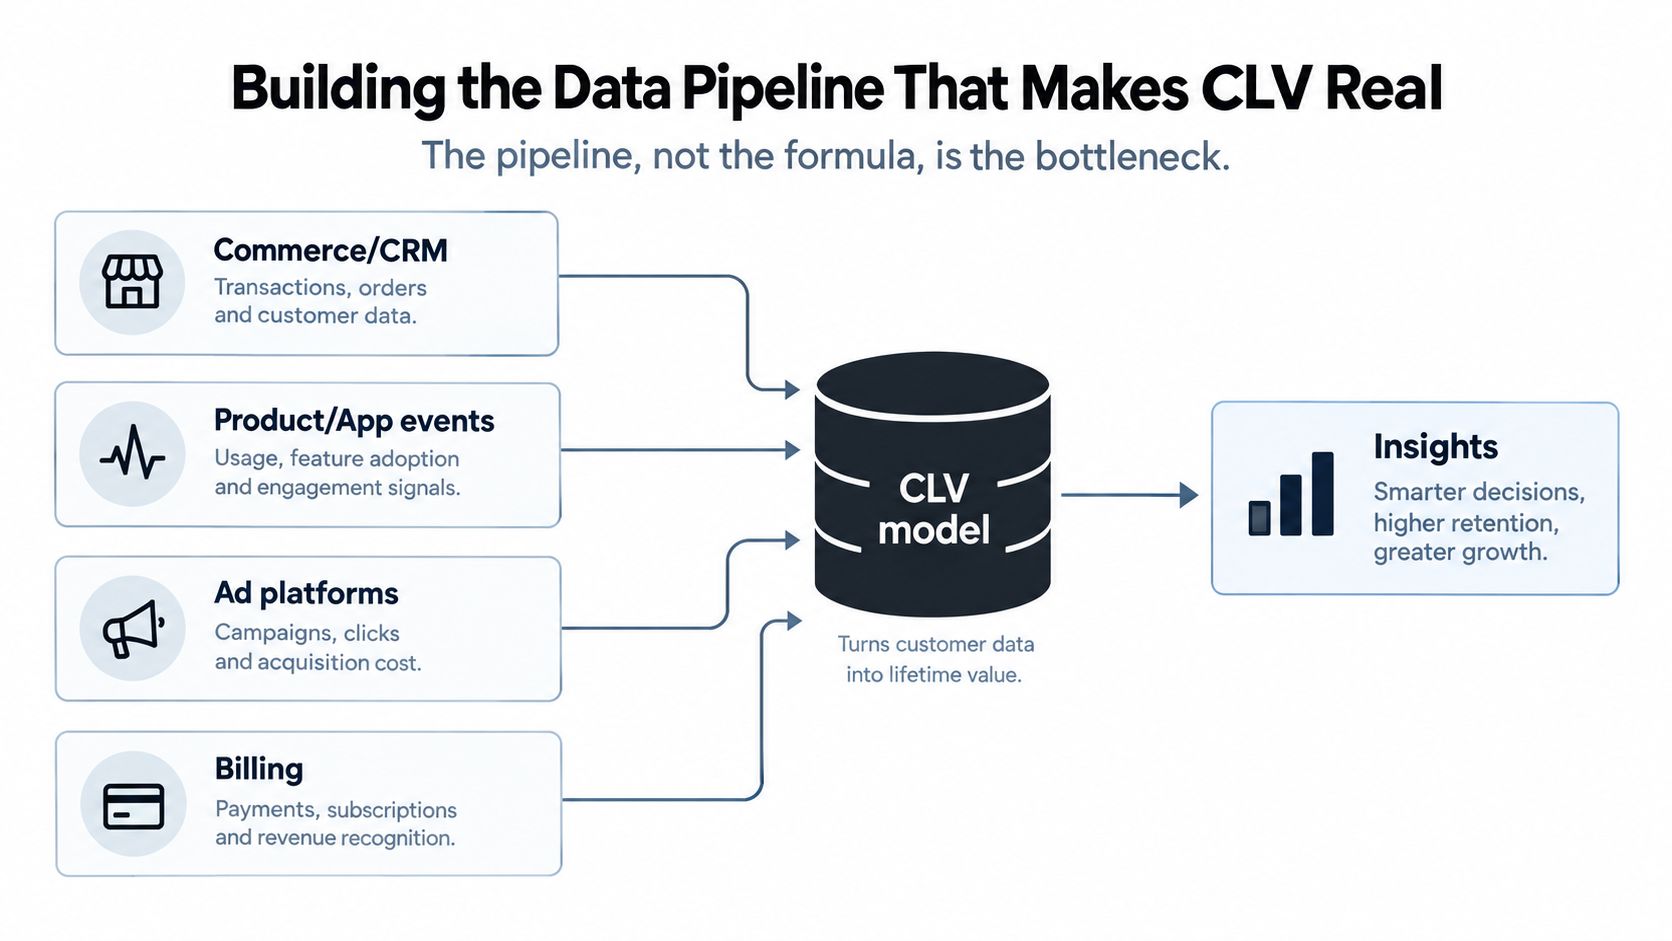
CLV becomes operational when scores travel back into the systems where teams work. Reverse ETL can send value tiers to a CRM, route high-potential accounts to customer success, suppress unprofitable audiences, or trigger a win-back journey for customers whose predicted future contribution still justifies contact.
Governance checks should answer practical questions:
Without this plumbing, teams blend gross and net revenue, double-count refunds, lose customers across devices, or act on outdated scores. A marketing automation and CRM integration process can connect the model to execution, but the source definitions still need to be owned internally.
A mid-market B2B SaaS company usually doesn't need one universal customer score. It needs an account-level view of expected contribution, expansion potential, service burden, and renewal risk.
The team can begin by separating accounts by plan, acquisition source, implementation profile, and early product usage. Sales development then gives priority to accounts whose modeled contribution clears the approved payback requirement. Customer success creates different intervention paths for accounts with high renewal value, high expansion potential, or high support cost.
Finance has a specific role. It should approve the margin definition, CAC allocation, discounting treatment, and forecast horizon. Marketing owns acquisition quality, sales owns expected deal economics, product owns activation signals, and customer success owns retention interventions. Weekly experiments become easier to prioritize because each team can connect its work to a shared value outcome.
Operating principle: CLV shouldn't replace judgment about an account. It should make the economic consequences of that judgment visible.
A DTC subscription brand faces a different problem. Its useful unit may be the customer and subscription cohort, with attention on forecasted near-term contribution rather than historical spend alone. The brand can divide lapsed purchasers into groups based on predicted future value, product affinity, margin, and likelihood of returning.
High-value lapsed customers may receive a personalized replenishment or service message. Lower-value customers can enter lower-cost automation. The team can shift paid spend toward audiences resembling high-value cohorts, but it should validate the change against subsequent contribution rather than assume lookalike quality from early conversion alone.
For B2B, a weekly review might decide which accounts receive SDR attention, onboarding support, or expansion outreach. For B2C, it might decide which cohorts receive a win-back offer, cross-sell message, or no paid reactivation.
The common pattern is not a particular channel. It's a closed loop:
Personalized journeys work best when they reflect those value differences. Personalization in marketing provides a useful activation context, while CLV supplies the economic filter for deciding who should receive which intervention.
The 3:1 CLV-to-CAC ratio is a useful operating benchmark, not a law of nature. Industry guidance describes about 3:1 as a widely used target, with ratios below 1:1 signaling unsustainable growth and materially higher ratios potentially indicating underinvestment. The CLV-to-CAC benchmark guidance also connects healthy scaling with a practical payback constraint of about 18 months.
The ratio only works when CLV means profit-adjusted contribution and CAC includes the relevant acquisition costs. A revenue-based CLV can make a ratio look healthy while fulfillment, support, discounts, refunds, infrastructure, or sales effort consume the supposed return.
The same caution applies to churn thresholds and payback rules. A monthly churn figure has different implications for a low-margin consumer subscription business than for a high-margin enterprise contract. A payback period that works for one cash-flow profile can strain another.
| Benchmark | Underlying Assumption | Where It Misleads |
|---|---|---|
| About 3:1 CLV:CAC | CLV is contribution-based and CAC is fully loaded | Blended averages hide weak cohorts or margin-heavy customers |
| Payback under about 18 months | The business can fund acquisition through the recovery period | Long sales cycles, annual prepayment, or cash constraints change the tolerance |
| Churn as a single monthly rate | Customers behave consistently across time | Seasonality, involuntary churn, downgrades, and cohort differences distort the average |
| One company-wide CLV | Customers share similar economics | Channels, products, geographies, and service loads often differ sharply |
A board-ready review should ask:
Teams comparing acquisition economics can use a customer acquisition cost framework, but the final decision should still rest on internal contribution and cash-flow evidence.
A CLV program doesn't need to begin with a complex model. It needs a definition that finance accepts, a customer key that data can reproduce, and a decision that marketing will change because of the result.
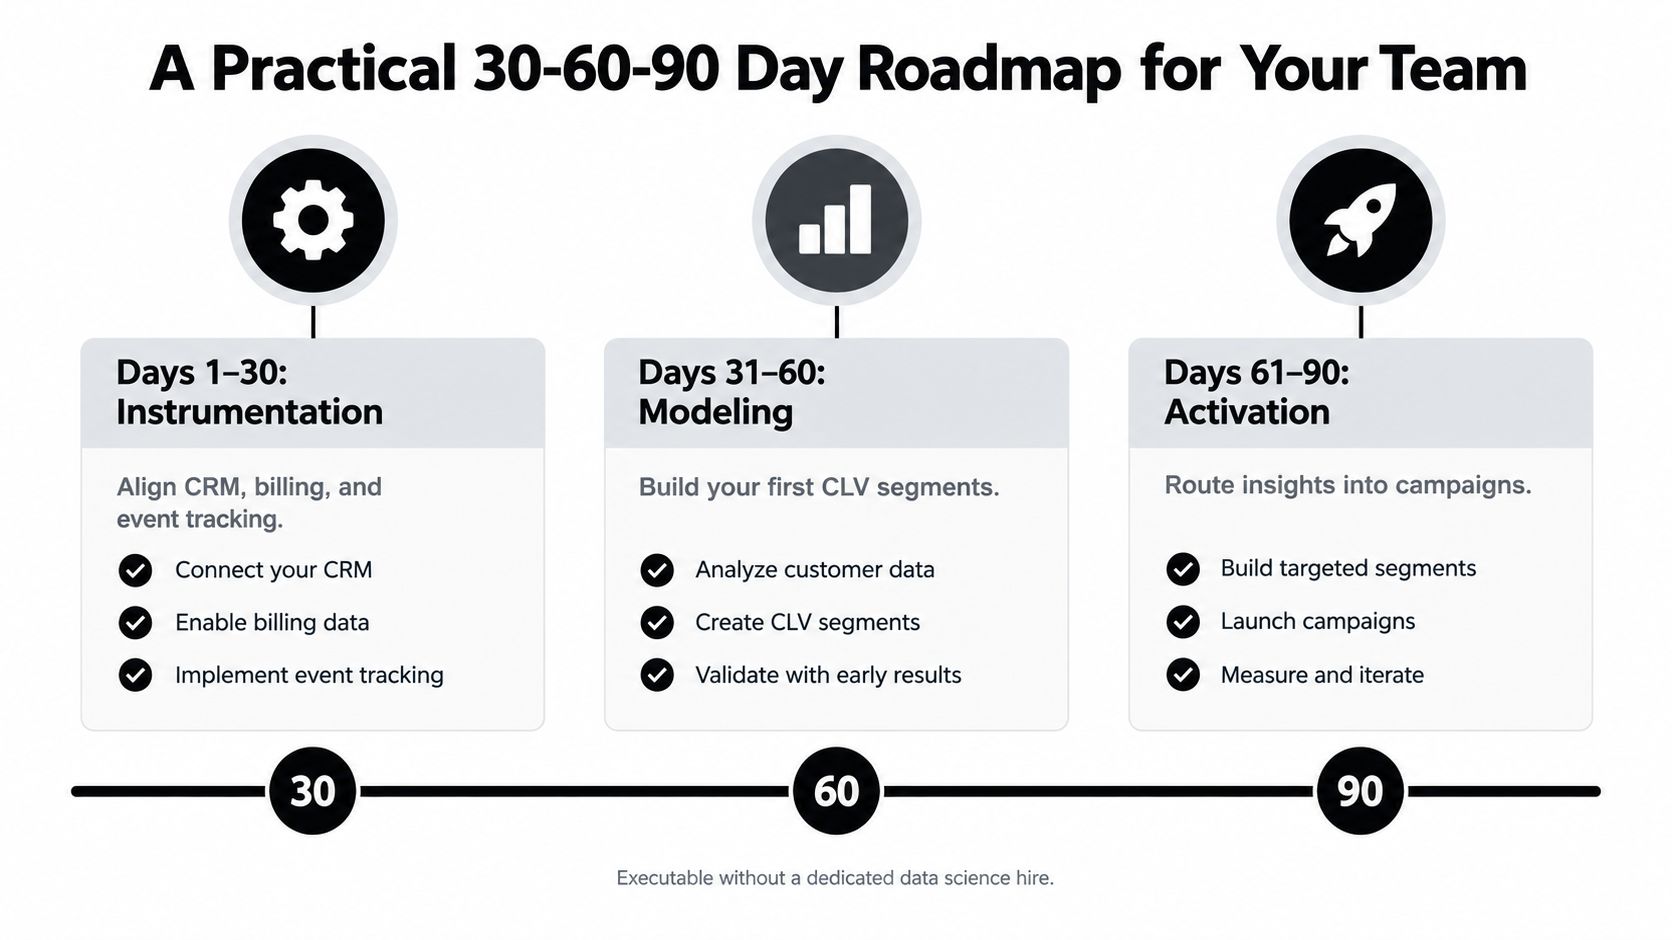
Align CRM, billing, commerce, support, and advertising fields. Define the customer or account grain, first-order date, cohort rule, contribution margin, CAC treatment, and reporting horizon. Ship one historical, profit-adjusted CLV number that leadership can trace back to source data.
The first review should not debate model sophistication. It should test whether revenue, refunds, costs, and customer identity reconcile well enough to support a decision.
Create practical segments by cohort, channel, product, plan, and lifecycle stage. Pair high-value segments with retention, cross-sell, onboarding, or service experiments. Instrument the four main levers, retention, frequency, order value, and margin, and compare each intervention with a control group.
The team should record the owner, hypothesis, expected behavioral change, contribution metric, and review date for every test. That prevents CLV from becoming a dashboard that nobody uses.
Introduce a predictive model only after the historical baseline is stable. Hold out a later cohort, compare predicted and realized contribution, and document where the model is wrong. Route validated scores into campaign, sales, and customer-success workflows, then establish a monthly review with named owners and decision rights.
A simple cadence works:
The compounding advantage comes from repetition: measure, activate, validate, and update before the organization drifts back to blended averages.
For teams that need help connecting acquisition, retention, analytics, and experimentation, Sprints & Sneakers offers growth scans, marketing analytics, automation, SEO, paid media, CRO, and full-funnel experimentation for B2B and B2C organizations. Visit Sprints & Sneakers to connect customer lifetime value analysis with a practical growth plan and the next set of measurable experiments.
Growth marketing, AI and automation, SEO, performance marketing, retention strategies, and sustainable business practices.
Weekly. Subscribe to our newsletter to get new articles straight to your inbox.
Absolutely. Everything we publish is designed to be actionable. Take it, test it, and make it your own.
Yes. We publish experiments with real numbers. What worked, what didn't, and what we learned.
Our growth team — strategists, performance marketers, data specialists, and AI builders who work on client campaigns every day.
We're open to it. Reach out via our contact page with your topic and we'll take a look.