
Digital Marketing Strategy Framework for 2026
Build a digital marketing strategy framework across six funnel stages, with KPIs, sprint priorities, and B2B and B2C examples for 2026.
Only about 3% of website visitors identify themselves through forms, according to 6sense's guide to changing B2B buyer research. A marketing dashboard built around form submissions therefore shows only a narrow slice of buyer behavior. It can record the moment someone becomes visible without explaining what made that person interested.
A digital marketing strategy framework should connect that hidden influence to measurable business outcomes. The useful model is a relay: each interaction helps a buyer reach the next decision, while the team concentrates each sprint on the handoff that needs the most work. AI, campaigns, and marketing technology support that measured bet, rather than becoming separate projects.
Table of Contents
- Six Stages From Awareness to Referral
- Why Channel Dashboards Miss the Decision
- Measurement Rules Before You Move Budget
- How to Pick One Bottleneck Each Sprint
- B2B and B2C Plays for Tomorrow Morning
- Where AI Belongs in the Framework
- Run Your First Sprint This Month
Six Stages From Awareness to Referral
Full-funnel stages, KPIs and next-day actions
| Stage | Question it answers | Primary KPI | Next-day action |
|---|---|---|---|
| Awareness | Do the right people know the problem and the brand? | Reach among the target audience, or branded-search volume | Publish one problem-led asset aimed at a real search or sales question |
| Acquisition | Do they reach a page, ad or inbox the business controls? | Qualified visits or cost per qualified session | Fix the landing page with the worst Core Web Vitals or bounce from paid traffic |
| Activation | Do they experience the core value? | Activation rate, such as demo booked, first order or account used | Instrument that event and remove the largest form or signup friction |
| Revenue | Does value become profitable revenue? | Pipeline or revenue per visitor, and contribution margin | Audit the biggest drop from proposal or cart to paid |
| Retention | Do they buy again or expand? | Repeat purchase rate, net revenue retention or churn | Launch one day-7 or day-30 save or repeat-buy message |
| Referral | Do customers create the next demand? | Referral rate or referred revenue share | Ask five recent buyers for one specific introduction |
The table assigns each stage a job. It doesn't suggest that every buyer follows a tidy sequence, or that every business needs the same conversion event. A software trial and a kitchen purchase involve different decisions, but both need an explicit definition of progress.
The journey can also be visualized through broader conversion and expansion stages.
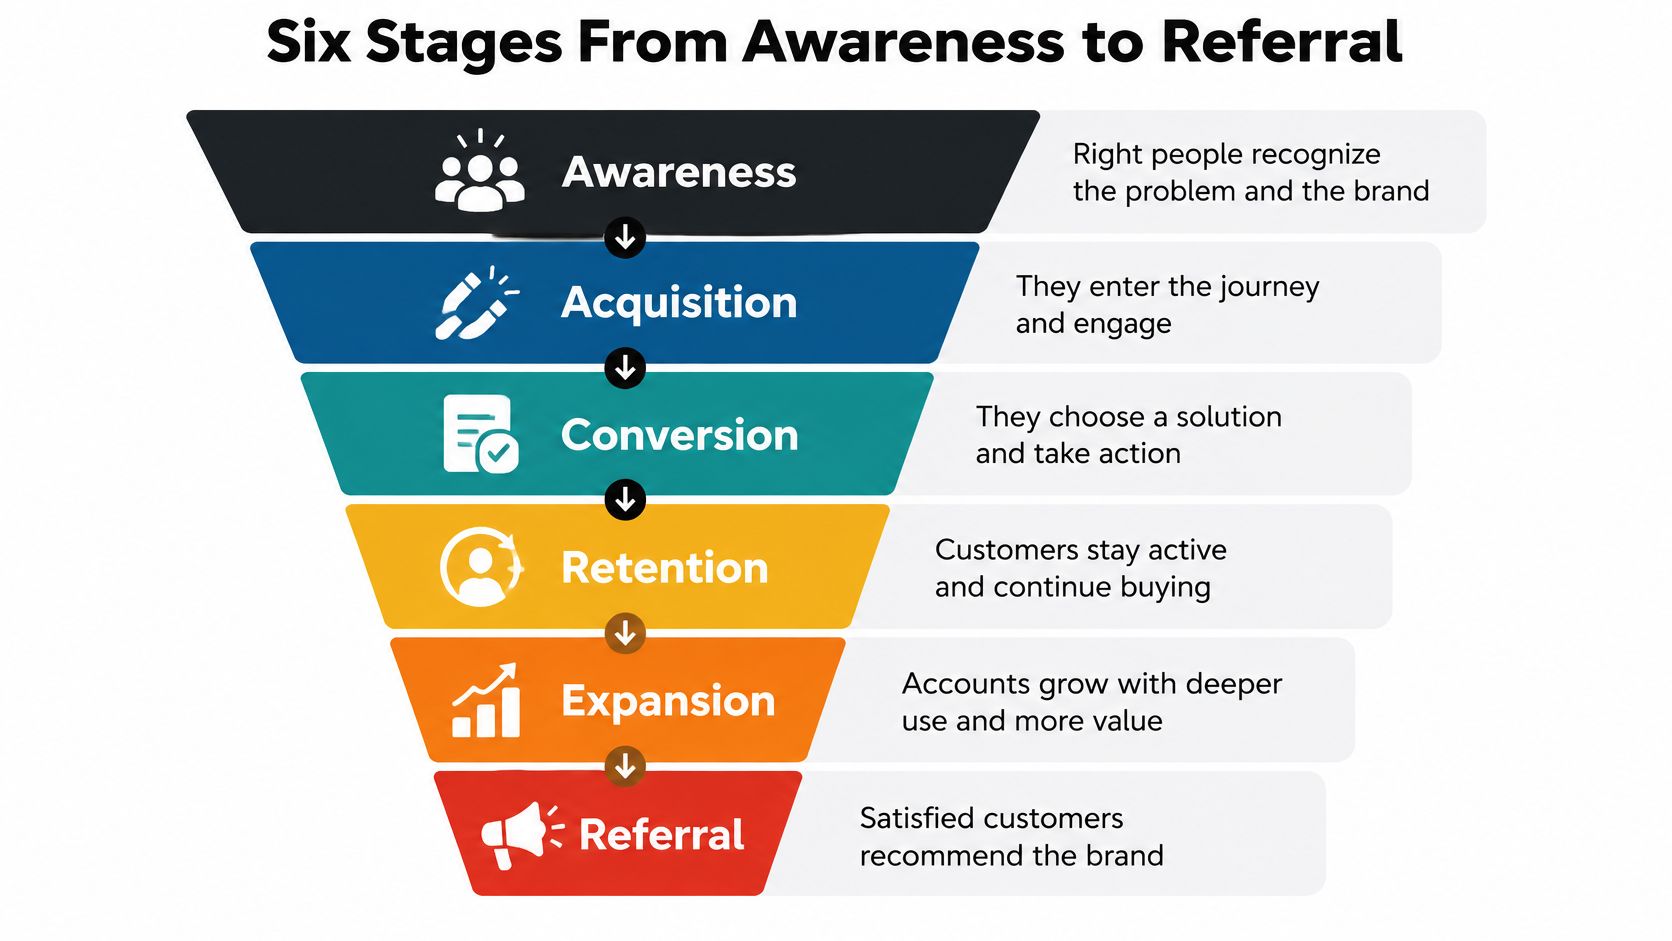
For sprint planning, the table separates activation from revenue and groups expansion with retention. That makes the first meaningful experience distinguishable from the commercial result.
Give every handoff an owner
The brand lead owns awareness. A useful starting asset answers a problem buyers already discuss, such as how to replace a manual approval process without disrupting operations. Recognition matters more than publishing volume.
The acquisition lead owns qualified visits. That person checks whether the asset attracts suitable buyers and whether the destination delivers on its promise. An ad about reducing approval delays shouldn't land on a generic company overview.
The product or conversion lead owns activation. A booked demo counts only if the business deliberately chooses it as the first value event. For a self-service product, actual use of a core feature may be more informative than account creation.
The commercial lead owns revenue. This person connects behavior to paid outcomes and margin, rather than treating every signup as equally valuable. A proposal audit might reveal that buyers understand the product but can't justify the implementation cost internally.
The customer success lead owns retention, including renewal and expansion. A save message should respond to a recognizable need, such as an unused account or an approaching replenishment moment, rather than sending a generic discount.
The customer marketing lead owns referral. A specific introduction request gives satisfied customers a clearer action than a broad request to spread the word.
Operating rule: The table is a map, not permission to run six projects at once. Only the stage where volume looks fine and the next stage collapses is this sprint's work.
The team should circle that stage before reading on. If the evidence isn't strong enough to choose, the first task is checking the handoff, not launching another campaign.
Why Channel Dashboards Miss the Decision
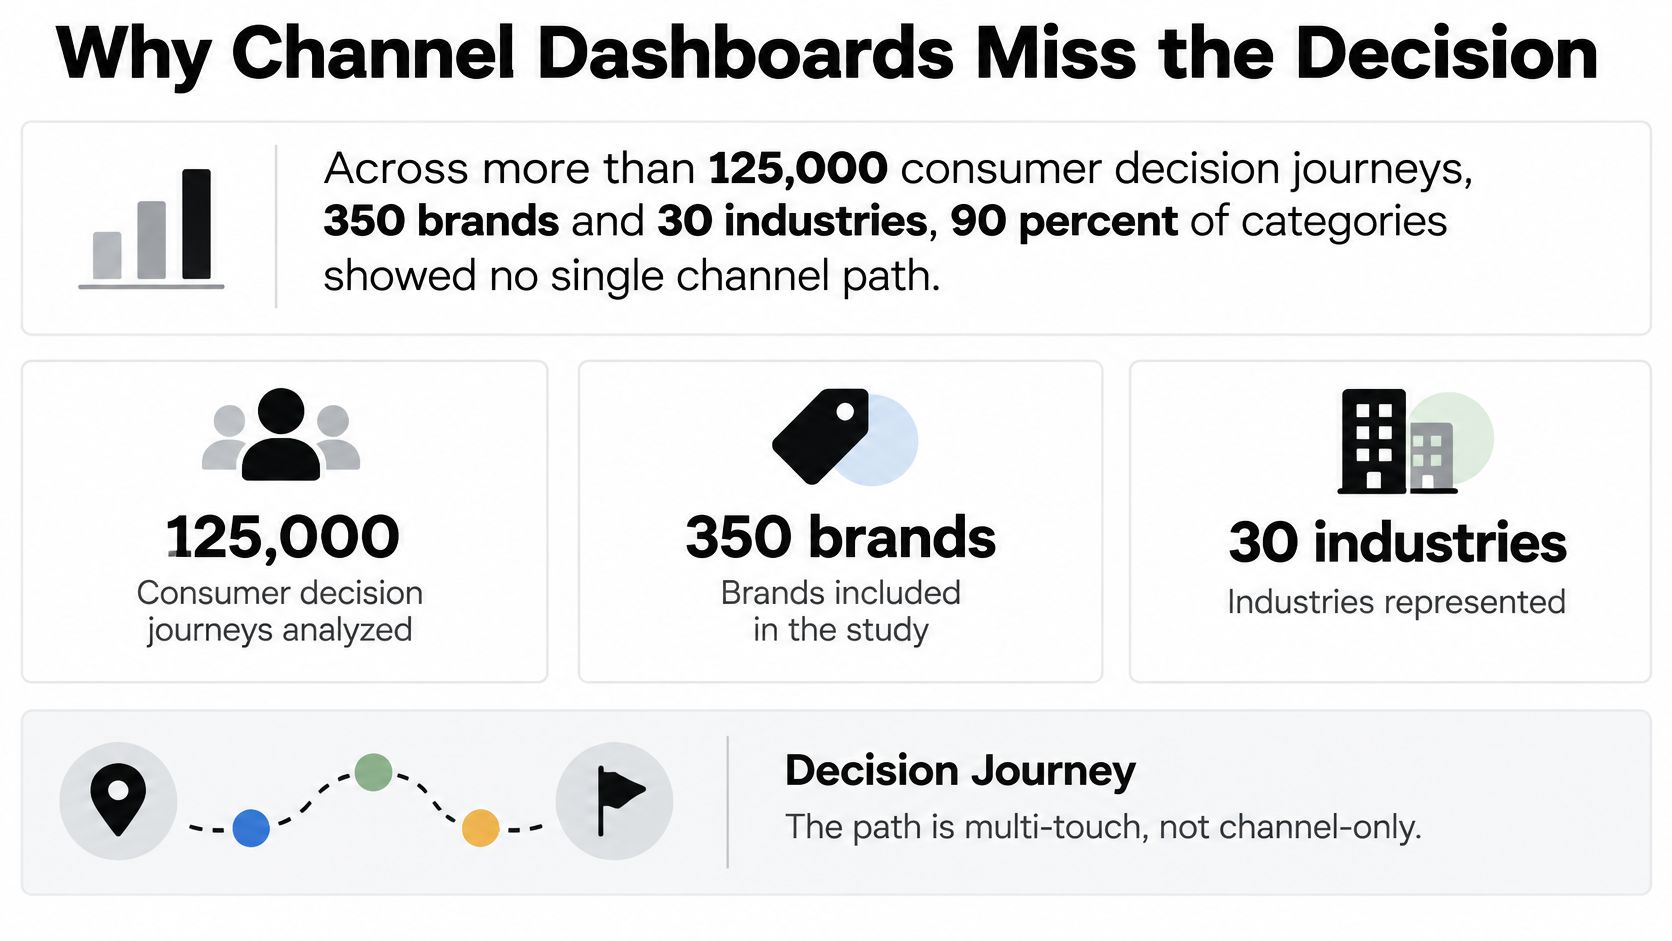
58% of customers switched brands from one purchase cycle to the next, according to McKinsey's analysis of more than 125,000 consumer decision journeys across 350 brands and 30 industries. The same analysis found that 90% showed no customer loyalty. Nearly 70% of brand choices happened at the beginning of the journey, and two-thirds of decisions were informed by experience quality along the way. These figures put the funnel in motion: each interaction can pass influence to the next.
A last-click report captures the runner crossing the finish line. It can show which channel recorded the final action, while leaving earlier contributions out of view.
Follow the decision, not just the click
Consider a SaaS operations buyer. A colleague shares an explanation of a workflow problem. The buyer reads an implementation guide, then searches and requests a demo. A capture-only dashboard may credit the final search, even though earlier interactions helped the buyer reach that decision.
For a consumer, useful content may introduce a product, search may lead to the purchase, and delivery or customer service may shape whether the shopper buys again. An acquisition report records the first sale, but it does not explain the repeat-purchase decision.
Three principles follow:
- Loyalty needs active work. Retention and referral belong in the strategy because a previous purchase does not guarantee the next one.
- Early preference deserves investment. Cutting problem education to fund only existing demand can remove reasons buyers consider the brand.
- Experience belongs beside media. The website, sales conversation, delivery and service handoff need owners in the same plan as advertising.
Keep channel reporting in its proper role
Channel analysis helps diagnose execution. Teams assessing professional social content can use this guide to LinkedIn analytics tools. The decision still needs a wider view: engagement in one channel does not, by itself, show how buyers move from interest to action.
A shared marketing performance reporting structure can connect channel observations to business outcomes. Campaign teams can track whether attention becomes qualified engagement. Sales and service teams can record what helped or blocked the next decision.
Build a journey map with a customer need and a measurable outcome at every stage. Use campaign, site, CRM, sales and service records to follow the handoffs. Where records cannot connect an interaction to an outcome, capture the contribution qualitatively rather than treating the last click as the whole story.
Measurement Rules Before You Move Budget
When digital channels account for a large share of marketing spend, measurement rules determine whether teams learn from the whole customer journey or reward only the final click. Gartner reported that digital channels represented 61.1% of total marketing spend in 2025. That makes clear measurement more than a reporting task: it shapes which channels receive budget and which forms of influence remain visible.
A funnel works like a relay. Different channels pass influence from one stage to the next, while last-click reporting records only the final handoff. Use that view to diagnose conversion capture, not to decide that earlier stages had no value. Clear rules make the existing tools useful, and more tools rarely fix a missing framework.
Establish the rules before reallocating spend
Set these rules before comparing channels:
- Start with the business outcome. Name the commercial result the team wants, such as closed revenue or repeat purchases, before choosing a platform or dashboard.
- Separate activity from value. Content engagement and demo requests are useful micro-conversions. They show progress, but they do not carry the same meaning as revenue or repeat purchases.
- Publish a measurement note. Record the primary conversion, reporting window, campaign naming rules, attribution model, and known gaps. This gives everyone the same basis for interpreting results.
- Require corroboration. Increase a channel's budget when multiple credible signals support the decision. A strong-looking dashboard on its own is not enough.
Google's GA4 attribution documentation explains how attribution models assign credit across conversion paths. Treat that credit as one view of influence, not proof that a channel caused the outcome.
Which measurement layer can move budget
| Layer | Question it can answer | Trust it when | Do not use it to |
|---|---|---|---|
| Last-click platform reporting | Which recent click sits next to the conversion? | You need a simple operational view of capture | Starve early demand because it rarely gets the last click |
| Data-driven or assisted attribution | Which earlier touches change path credit? | You compare it with a baseline and inspect large credit shifts | Treat model credit as proven incremental lift |
| Controlled experiment | Did this change cause more leads or revenue? | A geo, audience, or time holdout is feasible | Scale a result from one lucky week |
| Marketing-mix model | How does spend relate to sales over time? | The channel has real spend variation and a consistent time series | Judge a brand-new, low-reach channel week by week |
| Self-reported and sales evidence | What influenced the shortlist before a form fill? | You read forms, win-loss notes, and branded search together | Treat a survey answer as precise media ROI |
Match the method to the decision
Attribution models help explain how credit changes across the journey; experiments test whether a change caused more leads or revenue. Keep those jobs distinct. Comparing rules-based and data-driven attribution can show where credit shifts, while a controlled experiment provides a stronger test of causal impact.
For longer-term allocation, Nielsen's ROI report discusses relating media investment to outcomes over time. A practical marketing-mix modeling approach depends on spend variation and consistent historical records, rather than weekly scorekeeping.
For a narrower content check, the LinkedIn engagement rate calculator can support engagement analysis. That metric can help assess content response, but it cannot establish pipeline attribution.
Mark incomplete paths with an explicit confidence level. Review whether each measurement method has a clear purpose and named KPI before using its results to move budget. When the evidence disagrees, keep the funnel's handoffs in view: the best decision reflects the relay of influence, not just the final click.
How to Pick One Bottleneck Each Sprint
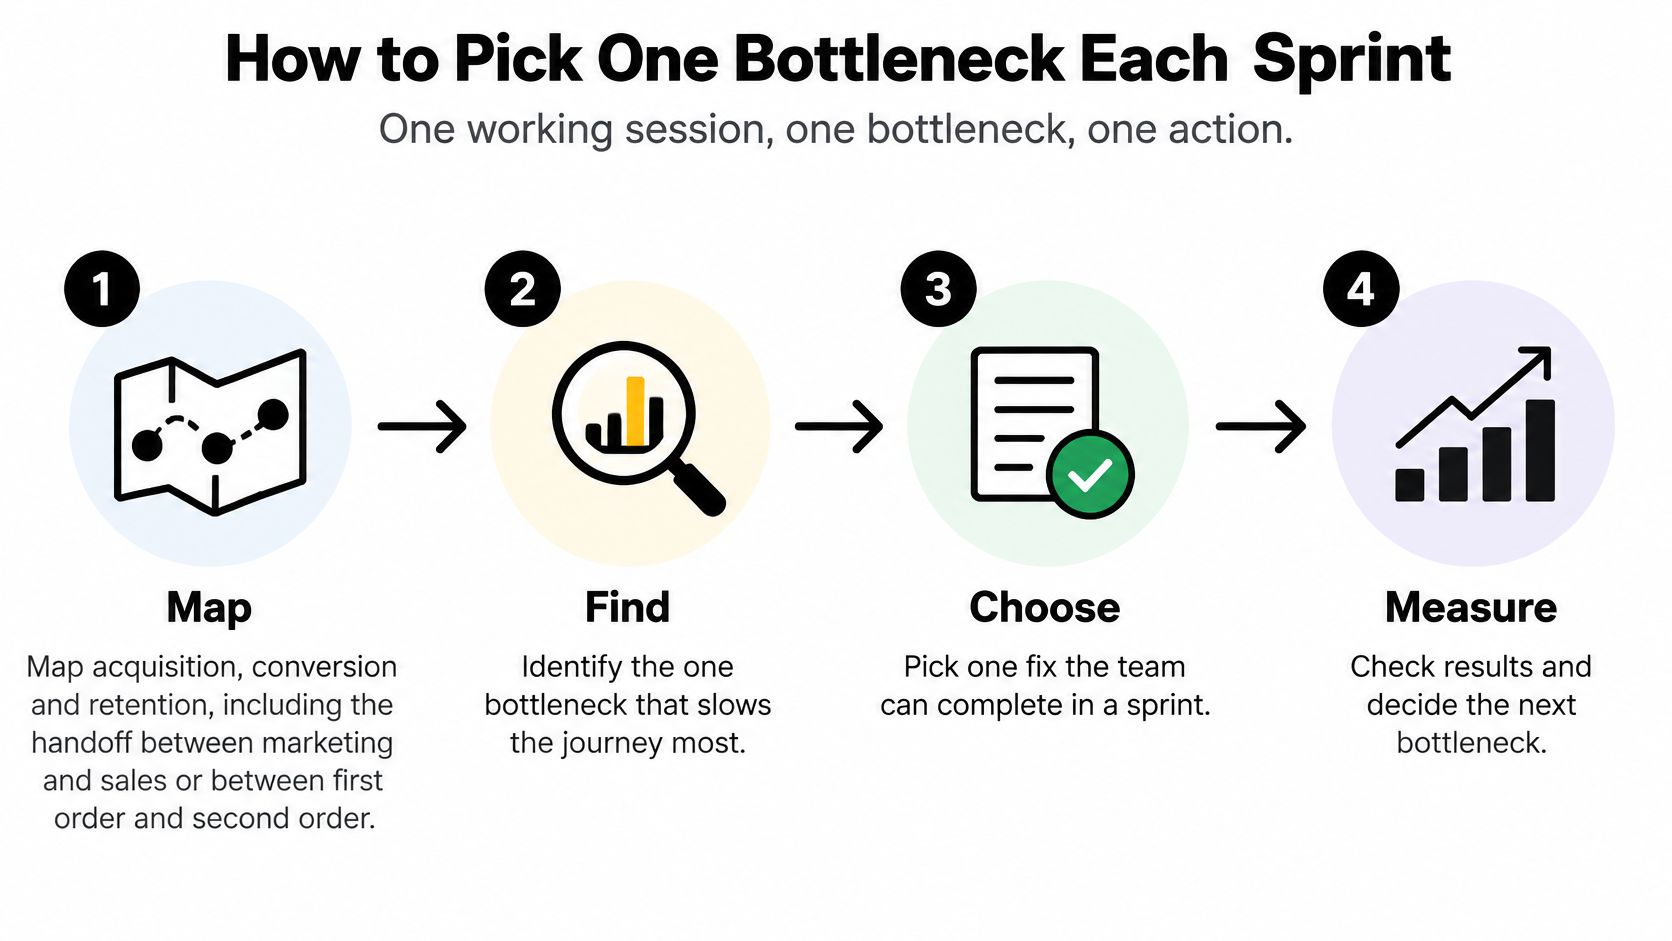
A sprint needs one constraint, one measured bet, and a clear review rule. Treat the funnel as a relay: each handoff can influence the next, even when the last click receives the credit. The job is to find where suitable people are dropping out, then give the team room to test a focused fix.
Run the working session
-
Map the actual handoffs. Trace acquisition, conversion, and retention, including the move from marketing to sales and from first purchase to repeat purchase. Sprints & Sneakers maps the full funnel, checks tracking and attribution, and builds a roadmap for the first sprint. That gives the team a shared view of where influence passes from one stage to another.
-
Verify the events. Have a team member complete the customer journey and check that the relevant events appear in reporting. Add missing sales outcomes or duplicate purchase events to a written gap list. Otherwise, a forecast may rely on activity that was never recorded correctly.
-
Rank the drops consistently. Compare the size of each loss, its commercial value, and confidence in the evidence. A visible traffic decline may look urgent, but a proposal handoff that loses suitable buyers could matter more. Use the same criteria for every candidate so the loudest dashboard does not choose the sprint.
-
Choose the constraint and forecast. Name the bottleneck, the angle and format to test, and the expected movement in the selected KPI. Forecasting makes the bet concrete: if the fix works, what should change, and where will the team see it?
-
Write the hypothesis before production. State who the change is for, why it should work, and how success will be measured. For an ad, write this down before design begins. The hypothesis keeps creative, audience, and measurement tied to the same decision.
-
Run, review, and course-correct. Keep the test focused through its agreed review. A B2B or industrial sale may need qualified-opportunity evidence over weeks, while a webshop may be able to assess checkout behavior sooner. Match the review window to the signal being measured, rather than judging every test on the same timetable.
Make technical friction comparable
For acquisition, page experience offers a practical diagnostic. Core Web Vitals thresholds described in Google's Web Vitals documentation classify performance at the 75th percentile of visits, using field data over the previous 28 days.
Core Web Vitals thresholds for scoring acquisition
| Metric | Good | Needs improvement | Poor |
|---|---|---|---|
| LCP, Largest Contentful Paint | 2.5 seconds or less | Above 2.5 through 4 seconds | Over 4 seconds |
| INP, Interaction to Next Paint | 200 milliseconds or less | Use Search Console's classification | Use Search Console's classification |
| CLS, Cumulative Layout Shift | 0.1 or less | Use Search Console's classification | Use Search Console's classification |
Search Console applies its own classification labels for INP and CLS. Use those labels to prioritize affected page groups, rather than guessing cutoffs. The acquisition owner can open the Core Web Vitals report, find landing-page groups marked Need improvement or Poor, and assign a fix to the most relevant bottleneck. A slow hero image may call for compression or preloading; a sluggish interaction may call for reducing JavaScript work.
A page-performance improvement is a sprint candidate, not proof of a revenue problem. Check whether the affected page sits on the handoff the team has chosen to improve.
Teams can use these marketing experiment examples to turn a diagnosis into a test. Prioritize pages and topics by their likely effect on leads and revenue, rather than spreading effort across everything at once. Keep the sprint card focused on the decision: Bottleneck stage ___ | Hypothesis ___ | KPI ___ | Owner ___.
B2B and B2C Plays for Tomorrow Morning
An industrial seller and a consumer webshop may share a funnel, but their stalled handoffs look different. Start with one buyer decision that appears blocked, then choose the smallest useful intervention. Keep marketing, sales, and customer teams focused on that decision.

The industrial seller with invisible shortlist influence
An industrial supplier receives suitable demo requests but cannot explain why buyers considered it. Sales hears familiar objections, while campaign reporting records the final visit and form submission. That leaves earlier influence out of view.
On day two, the marketing lead adds an optional, free-text discovery question to the demo form, asking how the buyer first heard about the company. The sales lead adds a win-loss question about what nearly kept the supplier off the shortlist.
Read those answers alongside three signals:
- Branded search and direct visits. Check for changes consistent with growing recognition, without assigning precise channel credit.
- Review-site presence. Check whether buyers can find credible reassurance about implementation and service.
- Content-assisted account engagement. See whether relevant accounts engage with technical explanations before contacting sales.
The goal is not a neat channel pie. Check whether form responses and sales notes reveal influence that campaign reporting misses, while keeping the form easy to complete. The useful measure is whether awareness is helping the right buyers enter the acquisition journey, not whether form volume rises.
The webshop with a shipping surprise
A retailer's mobile cart data shows shoppers leaving at shipping. Sending more traffic into that same checkout handoff is unlikely to fix the underlying friction.
Baymard's published average cart-abandonment benchmark is 70.19%, as summarized in the checkout diagnostic reference. Use it as context, not a target. The retailer needs its own cart-to-order and step-level measures.
The analyst counts users reaching cart, shipping, payment, and confirmation, segmented by device. If shipping is the main loss, test earlier delivery-cost disclosure. If payment is the issue, test clearer errors or another payment option.
The next-day check is whether each checkout step is recorded consistently and the largest device-specific loss is visible. Measure completed orders and contribution margin, not clicks on the payment button. This identifies the revenue handoff to work on in the sprint.
The embedded video can prompt a focused checkout discussion. Ask the team which step appears to lose buyers, what evidence would confirm that diagnosis, and which single change is worth testing first.
<iframe width="100%" style="aspect-ratio: 16 / 9;" src="https://www.youtube.com/embed/HLrgXuSI9Yk" frameborder="0" allow="autoplay; encrypted-media" allowfullscreen></iframe>Keep follow-up permission explicit
Email and SMS follow-up need their own controls. The ICO's direct-marketing guidance explains that UK marketing emails or texts to individuals generally require specific consent unless a narrow soft opt-in applies.
Use separate, unchecked choices on forms. Record the consent wording and time, identify the sender, and provide a working unsubscribe mechanism. The soft opt-in can cover customers who bought or negotiated to buy similar products or services, with an opt-out at collection and in every later message.
These controls belong in activation and retention workflows. Use acquisition marketing strategies to connect acquisition with a permission-aware customer journey, rather than treating every new contact as permission to send marketing.
Where AI Belongs in the Framework
94% of B2B buyers use AI across stages including problem identification, research, vendor comparison, testing, and negotiation, according to LinkedIn's 2025 Sales Leader Compass, as reported by Dialogue Review. The same report says nearly 90% of marketers use AI. These figures make AI part of buyer discovery as well as marketing execution.
A digital marketing strategy framework needs AI-assisted execution and AI discovery oversight. Buyers may use generative systems to research a category, so teams should check whether those systems can find accurate product descriptions and supported claims.
Automate preparation, retain judgment
Use AI for recurring research sweeps, reporting drafts, and creative variants. Keep decisions about the offer, evidence, and claims on price, risk, performance, and competitors with a human owner.
Sprints & Sneakers pairs Growth Marketers with AI agents for research, reporting, and execution. The team can move faster while a named person remains accountable for what gets published.
A practical responsibility split:
- Automated preparation. Gather recurring questions, summarize approved material, draft reporting commentary, and propose variants.
- Human approval. Check sources, commercial terms, customer meaning, and anything that could misrepresent the business.
- Written ownership. Assign a reviewer and record the evidence behind the final output.
For a problem-led video experiment, ClipNova AI's YouTube video maker can support production. A marketer still approves the script, checks factual claims, and defines the intended conversion.
Check what buyers can discover
Inspect how generative systems describe your category, brand, proof points, pricing, and perceived risks. Check the evidence buyers and AI systems can access before publishing more pages.
Give those systems concrete, consistent information: clear product facts, authoritative explanations, third-party validation, and language that reflects what customers say. For a consumer brand, accurate product feeds and review language should match the actual offer.
Governance test: If nobody can identify the source, reviewer, and intended business outcome, the output isn't ready to ship.
Keep privacy controls alongside source checks. Set rules for which customer records may enter an automated workflow, and require a clear business reason for their use.
The benefits of AI in marketing are measurable when a team compares an AI-assisted journey with a conventional search or paid journey against a chosen business outcome. Write down what AI handles, what remains with a person, and which KPI will show whether the change added value.
Run Your First Sprint This Month
A sprint turns a funnel diagnosis into one measured bet. Name the constraint first, then decide the budget. Funding every channel a little can leave the important handoff unchanged, while another tool can delay a decision the existing evidence already supports.
For an awareness bottleneck, build a problem-led asset and define how recognition will be measured. For an activation or revenue bottleneck, focus on the largest relevant drop-off and track whether it improves. Keep the funnel in view: each stage passes influence to the next, so a last-click result alone may miss where the handoff is failing.
Put the commitment where the team can see it
Use the sprint card from the bottleneck section to make the decision visible and keep the team aligned. Before an asset is made, write down the audience, proposed change, and reason it should work. Choose a primary KPI that can support or reject the bet, then set a review point within the coming month. Where the sales cycle takes longer, note the later outcome window too.
If the team cannot agree on the constraint, an outside assessment can help clarify the opportunity before the next budget decision. Sprints & Sneakers offers growth strategy, performance marketing, and GEO for B2B and B2C brands, delivered in sprints and accelerated by AI. Teams ready to turn their digital marketing strategy framework into a focused experiment can visit Sprints & Sneakers and ask founder Bart about a growth scan.
The next-day move is practical: make the sprint decision visible, then pause campaigns that cannot name the funnel stage they are meant to improve.
Related articles


Frequently asked questions
Growth marketing, AI and automation, SEO, performance marketing, retention strategies, and sustainable business practices.
Weekly. Subscribe to our newsletter to get new articles straight to your inbox.
Absolutely. Everything we publish is designed to be actionable. Take it, test it, and make it your own.
Yes. We publish experiments with real numbers. What worked, what didn't, and what we learned.
Our growth team — strategists, performance marketers, data specialists, and AI builders who work on client campaigns every day.
We're open to it. Reach out via our contact page with your topic and we'll take a look.