
What Is Marketing Mix Modeling? a Practical Guide for 2026
What is marketing mix modeling? Learn how MMM works, its data inputs, limits vs. attribution, and how to turn results into smarter budget decisions.
Marketing mix modeling is a statistical method that estimates how each marketing channel and non-marketing factor drove sales over time, using aggregated data instead of individual user tracking. That's the short answer to what is marketing mix modeling, but it doesn't explain why a dashboard can look confident while the budget decision still feels like a guess.
A team spends on television, search, social and out-of-home, launches a promotion, then watches sales jump during a holiday week. Every channel claims part of the lift. MMM puts those weekly totals into one model, separates likely drivers from background demand, and produces a planning hypothesis that still needs testing.
Table of Contents
- What Marketing Mix Modeling Actually Is
- The Data a Marketing Mix Model Needs
- How Carryover and Diminishing Returns Shape the Math
- Marketing Mix Modeling Versus Multi-Touch Attribution
- Where Marketing Mix Models Mislead and How to Check Them
- How to Build Your First Marketing Mix Model in Eight Steps
- Integrating MMM With AI and Experiments at Scale
- Turning Model Output Into a Budget Move This Quarter
What Marketing Mix Modeling Actually Is
Picture a consumer brand selling through stores and online. Television runs in bursts, search stays on, social spikes around launches, and a price cut lands in the same week as a bank holiday. Sales rise, then fall, and nobody can point to one clean cause. That's the everyday mess MMM is built for.
A weather forecaster doesn't track every raindrop. The forecaster studies temperature, pressure, wind and humidity over many weeks to explain why rain happened and when it's likely again. MMM does the same with business data. It reads weekly sales, advertising spend by channel, pricing, distribution, promotions, seasonality, holidays, competitor activity and macroeconomic conditions as one time series, as described in an econometric overview of marketing mix modeling methods.
The baseline comes first
Some sales happen with no marketing at all because people already know the brand, need the product, or walk past the shelf. MMM estimates that baseline demand first, then measures what each channel adds on top after accounting for non-marketing drivers. That order matters. Without it, every euro of revenue gets handed to media, including revenue that would've arrived anyway.
The approach dates to the 1960s and grew from the marketing-mix framework introduced by Jerry McCarthy in 1964, which organized decisions around product, price, place and promotion. MMM turns that checklist into numbers a budget owner can act on.
- Which channels drove revenue: The model estimates each channel's incremental contribution, not just its clicks.
- What the next euro returns: Output can be expressed as contribution, return on ad spend, marginal ROI, or an optimized budget allocation.
- Where money should move: Comparing marginal returns shows which channel deserves more budget and which one is saturated.
MMM deliberately skips cookies and individual user paths. It needs weekly totals, not personal journeys.
That design means offline and online channels fit in one framework, and no personally identifiable tracking is required. It suits B2B companies with long sales cycles, consumer brands with several distribution routes, and teams working under stricter privacy limits. The trade-off is real, though. Reliable estimates need long, consistent datasets and careful handling of correlated activity.
The Data a Marketing Mix Model Needs
The dataset has a simple shape. One row per week, or one row per week per market, one column per input, and the sales KPI as the outcome the model explains. Google's open-source Meridian documentation on aggregated time-series data describes the same structure, with weekly revenue, spend or impressions, price, promotions, distribution, holidays and macro variables assembled for each market.
Consistency beats volume here. A smaller dataset with stable definitions beats a huge one where spend tracking changed without notice halfway through, because the model can't tell a tracking change from a real demand shift. Teams building this foundation usually start by tightening their broader measurement practice, which is where a clear grounding in marketing analytics pays off before any modeling begins.
| Input | Example | Why the model needs it |
|---|---|---|
| Sales KPI | Weekly gross-margin revenue | The outcome the model explains |
| Channel spend | Paid search, video, social, out-of-home spend per week | Lets the model link money to revenue |
| Impressions or reach | Weekly impressions or GRPs per channel | Separates media volume from media cost |
| Price and discounts | Average selling price, discount depth | Price moves can look like marketing effects |
| Promotions | Flash sales, bundles, free shipping weeks | Promotions lift sales on their own |
| Distribution | Store count, marketplace listings, sales-rep coverage | Availability drives demand |
| Seasonality and holidays | Week of year, public holidays, back-to-school | Repeating patterns must be removed before reading media effects |
| Competitor activity | Competitor share of voice or price index where observable | Rival moves change results |
| Macroeconomic conditions | Inflation, consumer confidence, interest rates | Economic swings affect every channel at once |
How much history and how much detail
Many practitioners look for at least two years of weekly history so seasonal patterns repeat enough times to separate from marketing effects. One December spike could be Christmas, a campaign, or both. Two Decembers give the model a fighting chance to tell them apart.
Geo detail helps further. Meridian can run at national level, but geo-level data is recommended when available, because each region with different spend becomes another variation the model can learn from. That's especially useful for brands running regional campaigns.
The practical move for tonight is unglamorous. Open a spreadsheet, list the nine inputs above, and mark which ones the team already tracks, which are missing, and which can be backfilled. That one-page audit usually reveals whether a model is feasible this quarter.
How Carryover and Diminishing Returns Shape the Math
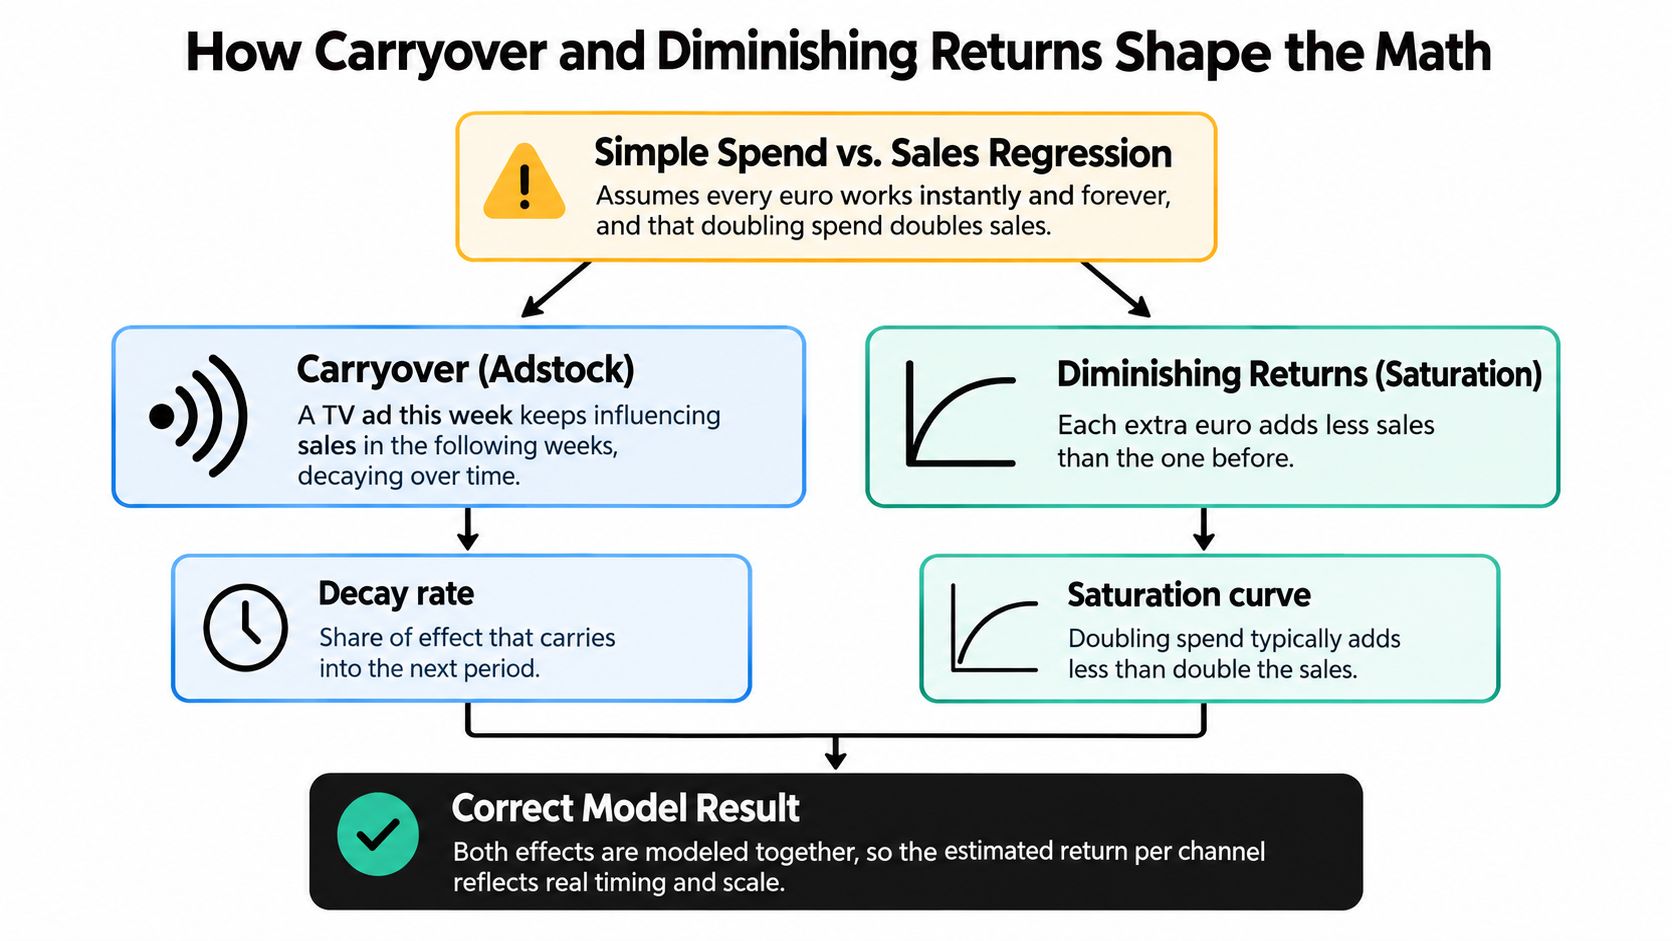
A simple spend-versus-sales regression makes two lazy assumptions. It assumes every euro works instantly and then vanishes, and that doubling spend doubles sales. Real advertising doesn't behave like that, and two mechanics, adstock and saturation, exist to fix those assumptions, as set out in research on adstock and saturation mechanics in MMM.
The diagram below shows how those two corrections turn a rough correlation into something closer to how demand actually responds.
Carryover works like an echo
Think of a television spot as a shout in a canyon. The shout is loudest in the moment, then the echo fades over the following days, still reaching people who weren't listening at first. Adstock is that echo in equation form. A reported example puts television adstock at 0.3, meaning 30% of the prior day's advertising effect remains the next day before decaying further.
Ignore carryover and the model blames this week's sales entirely on this week's spend. A brand flight that ended ten days ago gets no credit, while whatever channel happened to be live during the echo gets too much. The fix is mechanical. Each channel's spend gets transformed into a lagged series, so yesterday's exposure still counts, just less than today's.
Saturation works like a sponge
Pour water on a dry sponge and the first litres soak straight in. Keep pouring and the sponge fills, until extra water runs off and adds nothing. Saturation is the sponge. Early spend reaches fresh, receptive audiences, then each additional euro reaches the same people again or less interested people, so incremental sales shrink.
Saturation is often modeled with a Hill curve. Its alpha parameter controls the curve's shape, and gamma identifies the inflection or saturation point where returns start flattening. That's enough math for a budget meeting. The shape matters more than the Greek letters.
Practical rule: Never rank channels by revenue divided by spend. Inspect marginal return at several budget levels instead.
Consider an illustrative search budget moving from €40,000 to €50,000. A linear mindset expects incremental revenue to grow in proportion. Near saturation, that extra €10,000 might add only €2,000 of incremental revenue instead of €5,000, because the best queries and audiences are already bought. The channel hasn't stopped working. It has stopped scaling, and that's a completely different decision.
Marketing Mix Modeling Versus Multi-Touch Attribution
One line separates the two methods. Multi-touch attribution follows individual people across clicks and touchpoints and splits credit among them, while MMM looks at weekly totals across the whole market. Teams weighing the path-based side of that choice can compare it against how marketing attribution assigns credit across touchpoints before picking a primary method.
| Criterion | Marketing mix modeling | Multi-touch attribution |
|---|---|---|
| Question it answers | How much did each channel contribute to total sales? | Which touchpoints in each customer's path earned credit? |
| Data grain | Aggregated weekly or geo-level totals | Individual user or session paths |
| Needs user-level tracking | No | Yes |
| Offline channels | Covered in the same model | Usually missing or weakly linked |
| Time horizon | Long-term effects, carryover and saturation | Short path windows, often days or weeks |
| Privacy exposure | Low, no personal data | High, depends on cookies or identifiers |
| Causal strength | Estimates correlation unless calibrated with tests | Credit split is rule-based, not causal |
| Best for | Budget allocation across all channels | Campaign and creative-level optimization |
What adoption data actually shows
A 2019 IAB/MMA study of 116 advertisers, agencies, media companies, publishers and marketing organizations found 72% used either MMM or multi-touch attribution, with MMM more broadly adopted, especially among advertisers, according to the IAB and MMA guidebook on attribution and modeling adoption.
A global Kantar study conducted with Meta covered 1,935 measurement professionals at companies spending more than $1 million annually on digital marketing. Among large advertisers, 34% ranked MMM as their highest-priority measurement method, and 80% of MMM users used it, or wanted to use it, for tactical moves such as reallocating spend. Only 3% relied on MMM alone, while 51% combined it with attribution or experiments.
Adoption is still uneven. WARC's Marketer's Toolkit survey found only 2% of marketers used MMM, experiments and attribution together, while 22% used no modeling at all, as covered in reporting on WARC's measurement survey findings.
The verdict depends on the decision on the table. Privacy-constrained, offline-heavy or long-cycle businesses lean on MMM for budget allocation. Teams optimizing individual creatives or landing pages lean on attribution and experiments. Most mature teams run both and let each answer the question it's good at.
Where Marketing Mix Models Mislead and How to Check Them
A standard MMM estimates correlation, not causation. That's the uncomfortable point most explainers soften. The model sees that spend and sales moved together, and it can't, on its own, prove the spend caused the sales.
Channels rarely move independently. Paid search, retargeting, content pushes and sales activity spike in the same busy weeks, so the model can hand one channel credit for demand another created. High-intent buyers also self-select into exposed audiences, which inflates the apparent effect of whatever they saw last. In B2B, pipeline pushes, sales-team capacity, pricing changes and product launches can all masquerade as media impact.
The visual below weighs what MMM handles well against the failure modes that need active checking.
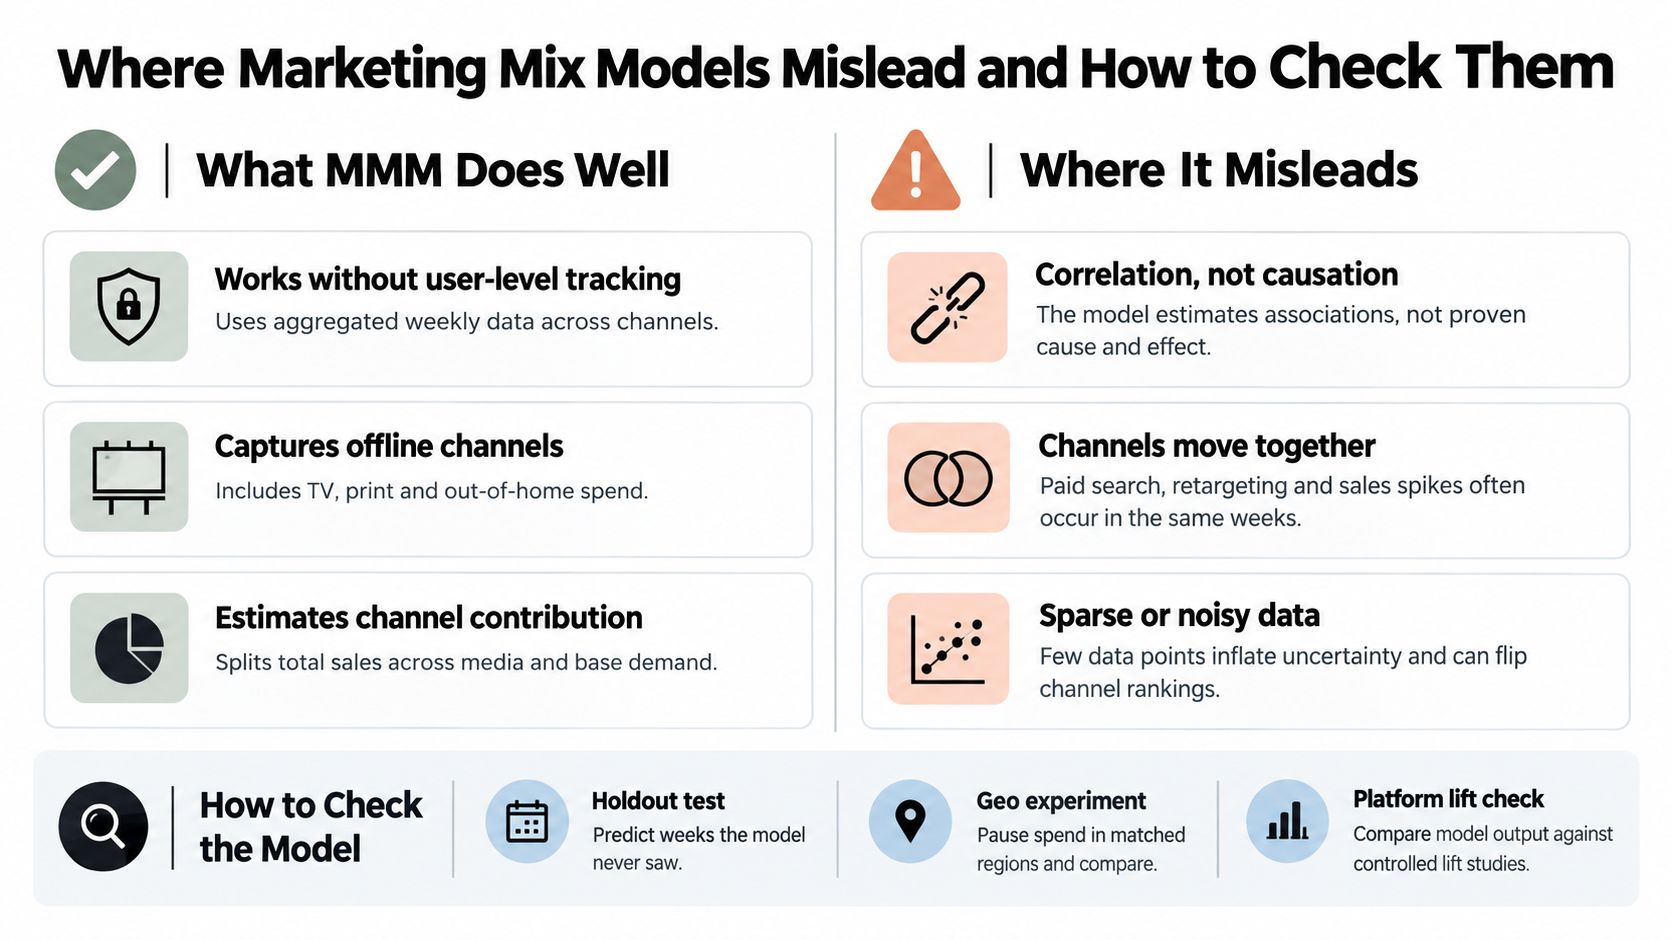
Google researchers note estimates become trustworthy only with sufficient data, meaningful variation in inputs, independent movement among variables, and controls for other sales drivers, a caution detailed in Google research on the conditions for credible MMM estimates. A fancier or AI-driven model can fit history better without solving any of that. Experimental methods often produce smaller but more reliable effects than observational models, because the test, not the algorithm, creates the clean comparison.
Three checks to run this month
- Hold out recent weeks: Fit the model without the last 8 to 12 weeks, then compare predictions against actuals. A model that can't predict unseen weeks shouldn't steer budget.
- Test the top channel: Run a geo test on the channel the model rates highest and check whether the direction agrees.
- Stress the controls: Remove one suspicious control, such as promotions or sales activity, and see whether the channel ranking survives. If a channel flips rank, its ROI is a hypothesis, not a number.
These checks also improve everyday discipline around marketing performance reporting, because they force teams to show how a number was validated, not just how it was calculated.
How to Build Your First Marketing Mix Model in Eight Steps
A useful MMM is an iterative loop, not a one-off report. Google describes Meridian as supporting data preparation, modeling, post-model evaluation, interpretation and budget optimization, including converting experiment results into model priors, per Google's Meridian workflow documentation for MMM. The loop below turns that workflow into eight steps a team can start next week.
The cycle diagram maps the loop before the steps break it down one by one.
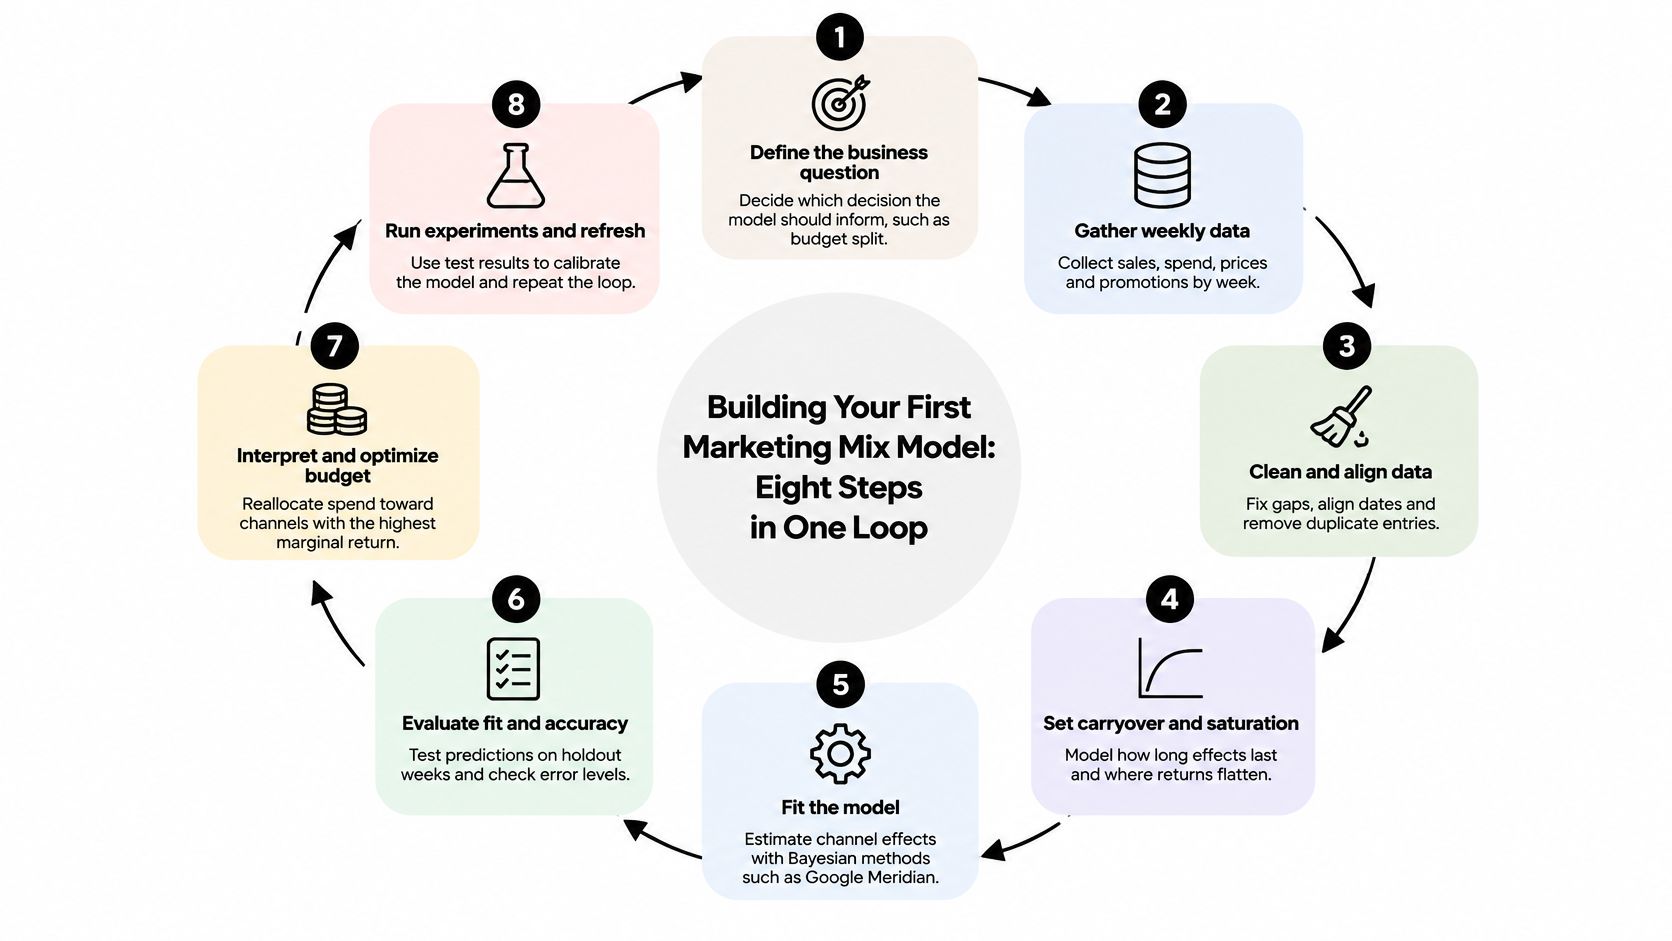
- Pick one KPI: Weekly gross-margin revenue works well, because mixing revenue and profit muddies every result. The common slip is switching KPI midway.
- Compile the weekly dataset: Use the input table from the earlier section as the checklist and audit spend records for gaps. Backfilling spend with a different definition than the original tracking is the trap here.
- Add controls before reading channels: Price, promotions, seasonality and holidays go in first. Skipping controls to get a cleaner chart just pushes their effects into media estimates.
- Set candidate adstock and saturation shapes: Start simple for each channel. Beginning with the most complex curve makes errors harder to spot.
- Fit candidates and test on a holdout: Compare models on a period the model never saw, not on in-sample fit, which flatters every model.
- Calibrate with a geo test: Raise spend in selected regions, keep comparable control regions unchanged, measure the difference, and use it to constrain the modeled contribution. Testing a single region leaves nothing credible to compare against.
- Read response curves and marginal return: The answer to chase is expected incremental revenue from the next €10,000 in search, video or out-of-home, not a historical ROAS ranking.
- Refresh and log every change: Update monthly or quarterly and record what changed. A stale model gradually becomes a confident fiction.
The short walkthrough below shows the loop in motion, from raw weekly data to a budget recommendation.
<iframe width="100%" style="aspect-ratio: 16 / 9;" src="https://www.youtube.com/embed/erK9Q1Wnvo4" frameborder="0" allow="autoplay; encrypted-media" allowfullscreen></iframe>An illustrative furniture webshop with three channels shows why step 6 matters. The first model credits video with 40% of revenue. A geo test in two regions shows a smaller lift, so the team lowers the video estimate and moves 10% of budget to search. The model proposed, the test corrected, and the budget moved on evidence rather than on a single blended number.
Integrating MMM With AI and Experiments at Scale
At scale, MMM runs on a quarterly cadence alongside a regular experiment calendar. The model proposes where money should move, tests confirm or reject the proposal, and the next refresh uses both. Feeding experiment results back as priors means each test sharpens the model instead of sitting forgotten in a separate deck.
Designing those tests well matters as much as running them. Structured methods for varying several factors at once, covered in resources on how to ottimizzare i processi con il DOE, help teams plan geo experiments and holdouts that produce clean, usable calibration signal rather than noisy one-off results.
Judging AI-driven tools honestly
Three checks separate a decision-useful tool from a black box:
- Explained assumptions: The tool states what it assumes about carryover, saturation and controls.
- Holdout performance: It predicts weeks it never saw, not just fits history.
- Reported uncertainty: Every channel estimate carries a range, not a single confident number.
Fit alone proves little, because predictive machine learning can improve fit without solving causal identification. A transparent model validated against experiments often beats a complex one nobody can explain in a budget meeting. Teams evaluating that trade-off will find the wider context in the practical benefits of AI in marketing, where prediction and proof are treated as different jobs.
For B2B, CRM-stage outcomes such as qualified pipeline belong alongside revenue, so the model sees the stage where media plausibly acts instead of waiting months for closed deals. One shared dashboard should show the model estimate, the latest test result and the gap between them. A gap that persists across two quarters signals a data or model problem to fix, not a number to pick.
Start with one channel, one geo test and one refresh cycle before adding tools.
Turning Model Output Into a Budget Move This Quarter
Model output only earns its keep when it changes a budget. The table below is a reading guide, because each output answers a different question and carries its own trap. Teams connecting these outputs to finance conversations will recognize the overlap with how marketing ROI gets defined and defended, where the wrong average can sink an otherwise sound plan.
| Output | What it tells you | Common trap |
|---|---|---|
| Contribution share | Share of sales each channel explains | Reads as ROI; it measures credit, not return on the next euro |
| Average ROAS | Revenue per euro spent on average | Hides saturation, so it overrates heavily funded channels |
| Marginal ROI | Revenue from the next euro spent | Changes with budget level; check it at planned spend |
| Response curve | How revenue changes as spend rises or falls | Flat sections mean extra spend is wasted there |
| Saturation point | Spend level where returns start to flatten | Estimates shift when new data arrives, so re-check it |
| Uncertainty range | Plausible span of each channel's effect | A wide range means test before moving large budgets |
| Budget scenario forecast | Expected outcome of a proposed mix | Valid only for spend levels the model has seen |
The decision rule that matters
Compare marginal ROI across channels, not averages. A channel with a glittering average ROAS may sit on the flat part of its response curve, where the next euro earns almost nothing. A channel with a weaker average may sit on the steep part, where the next euro earns plenty. Averages describe the past, marginal returns price the future.
- Move in steps: Shift 5 to 10% per channel at a time and watch whether results match the forecast.
- Respect the observed range: Scenario forecasts hold only for spend levels the model has seen. Forecasting far beyond that range is invention, not modeling.
- Let uncertainty set the pace: Wide ranges mean smaller moves and a test first. Narrow ranges, confirmed by experiments, allow bolder shifts.
The concrete next step fits in one week. Pull the weekly dataset from the input table, choose one KPI, and see what's missing. If data or experiment capacity is the blocker, Sprints & Sneakers begins with a personalized growth scan that finds the bottleneck limiting results before any model is built, so measurement effort lands where it changes decisions.
Ready to turn a first marketing mix model into budget decisions the whole team trusts? Visit Sprints & Sneakers to start with a personalized growth scan that pinpoints the bottleneck limiting performance, then build the measurement and experimentation loop around it. The first conversation focuses on which decision needs better evidence this quarter, and what data already exists to answer it.
Related articles


Frequently asked questions
Growth marketing, AI and automation, SEO, performance marketing, retention strategies, and sustainable business practices.
Weekly. Subscribe to our newsletter to get new articles straight to your inbox.
Absolutely. Everything we publish is designed to be actionable. Take it, test it, and make it your own.
Yes. We publish experiments with real numbers. What worked, what didn't, and what we learned.
Our growth team — strategists, performance marketers, data specialists, and AI builders who work on client campaigns every day.
We're open to it. Reach out via our contact page with your topic and we'll take a look.