
Competitive Marketing Strategy Playbook for 2026
Build a competitive marketing strategy with a force scorecard, cohort economics, messaging tests, and a 2026 AI visibility map.
Ask most growth leads what a competitive marketing strategy is and they'll show you a slide with ten rival logos down the left and a feature grid across the middle. That isn't a strategy. It's a rival inventory, and it fails the only test that matters: does it change where next quarter's budget goes?
The popular advice in 2026 says win on volume. Publish more, post more, ship more creative variants, out-produce the competition until the algorithm notices. It's comforting, because volume is the one lever a team can pull without thinking hard. It's also wrong more often than it's right. A campaign with weak market structure behind it and no proof a buyer can check doesn't get rescued by more output. It just gets louder on its way to the same flat win rate.
Competitive advantage this year gets won twice. Once in the economics of each cohort, where incremental margin after acquisition cost decides whether a segment deserves another euro. And again in the sources an AI answer cites when a buying committee is split between people who ask a chatbot for a shortlist and people who trust a peer, a publication, or a conversation. Miss either front and you're optimizing the wrong thing at speed.
Table of Contents
- Score the Five Forces Before You Spend
- How to Audit Customers and Rivals
- Turn Positioning into a Test You Can Lose
- Proof Paths for Split Buying Committees
- Build the Dashboard and the AI Map
- Prioritize Experiments Across the Funnel
- Run One Bottleneck Sprint This Month
Score the Five Forces Before You Spend
A feature grid tells you what rivals ship. It says nothing about whether acquisition spend can pay back in the market you're selling into, and market structure sets that ceiling well before a headline does.
In 1979, Michael Porter published How Competitive Forces Shape Strategy in the Harvard Business Review, and the five forces he named still do the diagnostic work a logo wall pretends to do. Porter's point was that competition isn't only a contest between existing rivals. It's the division of economic value between rivals, new entrants, buyers, suppliers, and substitutes. Every one of those is a marketing question, because each force pushes budget toward a different tactic. Powerful buyers reward switching costs, implementation proof, and retention offers. Abundant substitutes mean the message has to name a job the alternative cannot finish. Low entry barriers turn brand, distribution, proprietary data, and customer loyalty into the assets worth paying for.
Score one offer, not the whole catalogue
Rate each force from 1 to 5 for the market you sell in, not the market in the deck. Fill the table this afternoon for one core offer. Circle the single highest score, because that force is the question your next budget has to answer.
| Force | Signal to check this week | Move when the score is high |
|---|---|---|
| Rivalry among existing competitors | Share of search, win rate, review volume | Fund proof that changes the shortlist, not broader awareness |
| Threat of new entrants | How fast a new brand can copy the offer and the channel | Protect brand, distribution, data, and loyalty |
| Bargaining power of buyers | Discount pressure, procurement steps, switching ease | Build switching costs, retention offers, and implementation proof |
| Bargaining power of suppliers | Margin tied to one platform, data source, or media vendor | Reduce dependence before scaling spend on that supplier |
| Threat of substitutes | Jobs customers finish with another category or with doing nothing | Message the job the substitute cannot complete |
If rivalry scores 5, an awareness campaign is a donation. The audit has to explain why a buyer would put you on a three-name shortlist, and that answer lives in proof, not reach. If buyer power scores 5, the honest question is why anyone stays after month three. If substitutes score 5, the argument is a job the other category cannot do.
Supplier dependence is the force teams misread most often. It looks like a creative problem when a single ad platform, data provider, or marketplace listing owns your margin. It isn't. It's a structural exposure that shows up later as a cost per acquisition you can't argue your way out of.
Practical rule: the highest-scoring force gets the next budget conversation, not the loudest channel.
The same proposition can win where switching is costly and die where buyers hold all the power. That's why the deck comes before the campaign calendar.
How to Audit Customers and Rivals
Run the audit on one offer and one segment. Auditing the full catalogue is how these projects die in week three with a 40-row matrix nobody reads.
The case for doing it isn't new. A Brazilian meta-analysis covering 27 studies and 4,537 observations found a correlation of r = 0.39 between market orientation and business performance. Understanding customer needs, watching competitors, and coordinating the response travels with better outcomes. It doesn't guarantee them, and it isn't a licence to skip the work. It does mean the audit is the cheap part of the year.
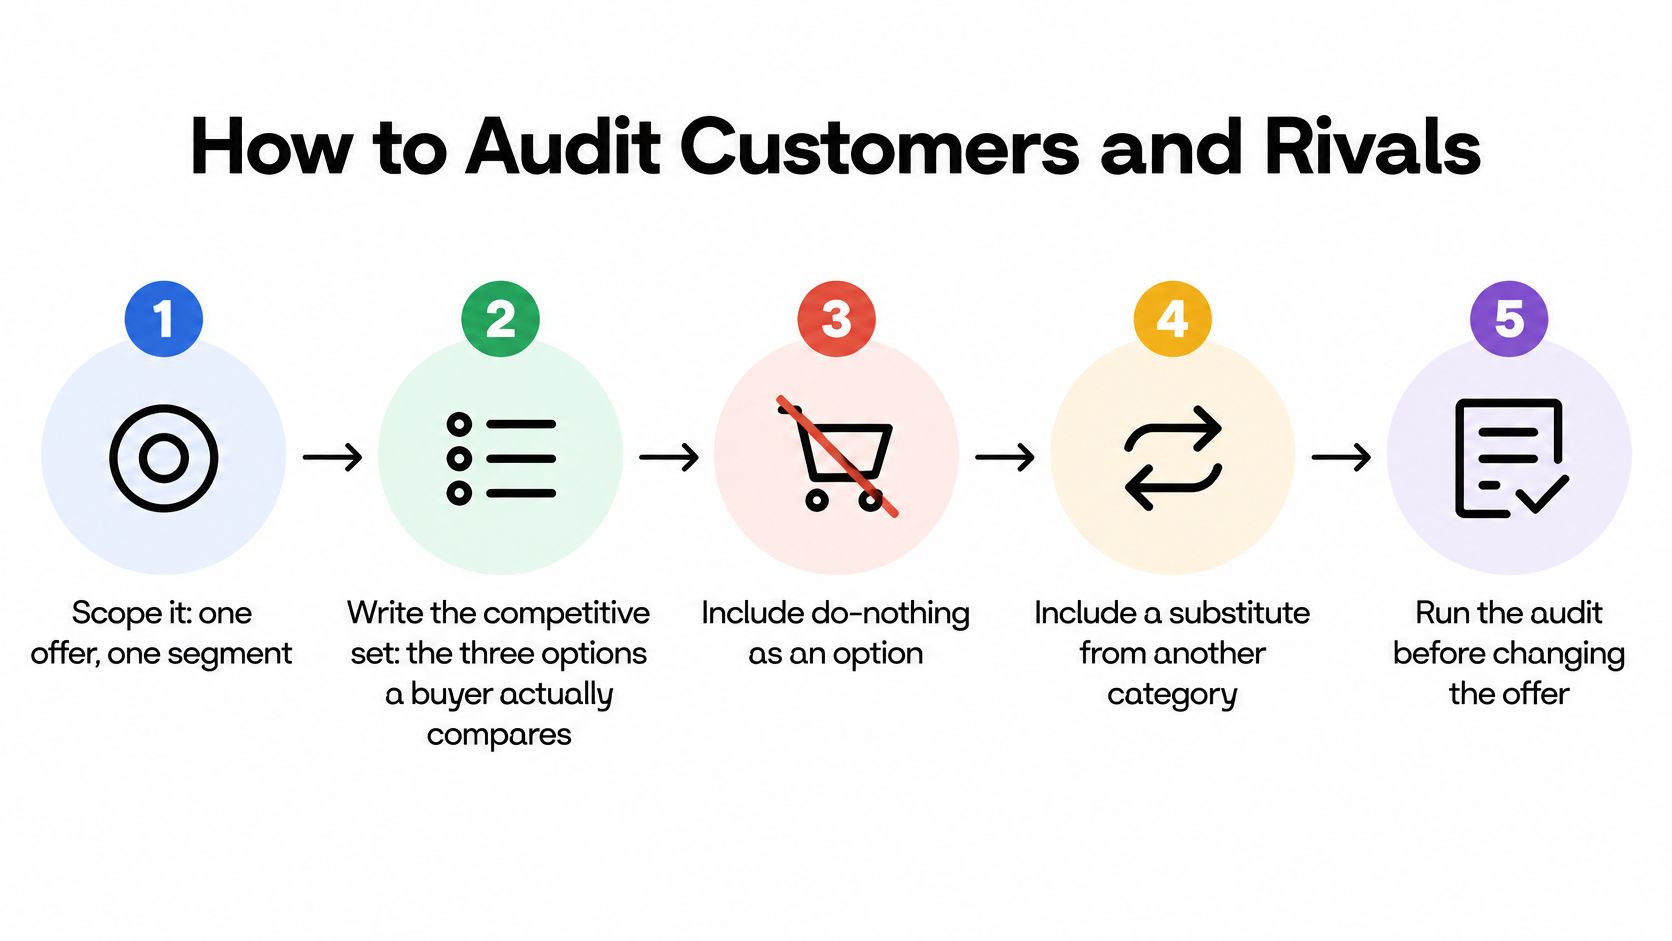
Six moves that fit in a week
- Write the competitive set as the three options a buyer compares. For an enterprise deal that's usually you, the incumbent, and the internal build. If your list only holds lookalike brands, you've left out the two options that win.
- Pull ten recent win and loss notes and tag three things. The job the buyer was hiring for, the price objection in their own words, and the proof they asked to see. A note that says "too expensive" is untagged until you know what it was compared against.
- Record observable rival signals only. Price band, review volume, product breadth, marketplace presence, and the switching friction a customer would hit. A rep's claim that a rival is "getting desperate" is not a signal.
- List the searches and AI questions buyers use from first orientation to ready to buy, then note which rival gets named in the top results. If a procurement question returns the rival's security page and yours sits behind a form, that's the finding of the week.
- Separate what you can verify before Friday from what is channel gossip. Two columns, two colours, no blending. The gossip column is where positioning goes to die.
- Write one sentence on the underserved combination. Faster implementation plus measurement the buyer can audit. Delivery by Thursday with guest checkout. One sentence, and stop once you can point to evidence for it.
A B2B team often discovers that procurement cares about security evidence the website hides behind a form. A webshop often discovers its real rival is a marketplace listing with faster delivery, not the brand it tracks in ads. Both findings are worth more than a share-of-voice chart.
A structured marketing research process keeps this to five working days. Hand the sentence to positioning, and don't brief creative until it survives a check against the notes.
Turn Positioning into a Test You Can Lose
A positioning sentence earns budget only when it can fail. Write it as a bet: this audience, this pain, this proof, this commercial result. If the wording cannot be checked against pipeline, orders, or repeat revenue, it is decoration.
Turn the sentence into a proposition you can lose in public. Grow Surf's customer retention statistics roundup reports that increasing customer retention rates by 5% increases profits by 25% to 95%. Use that as a commercial reason to treat positioning as a retention and conquest asset at once. Map rivals by job, segment, price, proof, service model, channel visibility, and switching friction. Then express the underserved combination as a falsifiable value proposition with a baseline, a holdout, and a stop rule.
Baseline before you touch the wording
Record five numbers on the current proposition: qualified conversion, sales-cycle length, win rate, expansion, and retention. No baseline, no test. A SaaS team can run a live comparison in fourteen days with a shared dashboard against a rival whose page leads with feature count. A shop can test delivery by Thursday plus guest checkout against a marketplace listing. Both need the same five numbers first.
Then change one asset at a time. A landing page, a paid-search line, a sales one-pager, onboarding, or a lifecycle email. Two simultaneous changes buy you a result you can't attribute and an argument you can't settle.
The claim should also work as a retention line, not just a conquest line. Losing an existing buyer costs far more than losing a first click, so the same proof asset should carry cross-sell, renewal, and referral messages. Do not retire it after the launch campaign.
Pre-commit the stop rule
Write down four things before the test starts: the primary metric, the smallest lift worth acting on, the run length, and the condition that ends it early. Judge incremental pipeline or gross profit. Not click-through rate. Not impressions.
A line that lifts clicks while win rate stays flat is a failed line, and it should die the week you learn that.
Teams let a clever headline run for a quarter because the dashboard looks busy. That is lazy budget management. The test asks whether the buyer who clicked moved closer to a signed deal or a completed order. If the proof does not support that move, cut the line and keep the market finding.
When the claim clears the bar, ship it with the evidence attached. A brand messaging strategy that cannot show its proof is just a tone of voice.
Proof Paths for Split Buying Committees
There is no single digital buyer. Design for the committee you get.

A Magenta Associates report on how AI is shaping the B2B buyer journey found that 66% of UK decision-makers use AI tools to research and evaluate suppliers, but adoption splits hard by age: 85% of respondents aged 25 to 34, 33% of those aged 45 to 54, and 23% of those aged 55 to 64. AI users mainly validate facts and summarise reviews. After discovering a supplier through AI, 79% visited its website, 67% looked for reviews, and 59% made an inquiry or purchase.
That spread has a straightforward consequence. Half a committee arrives through a generated shortlist. The other half wants a peer, a publication, or a person on the phone.
<div style="margin: 2rem 0;"> <iframe width="100%" style="aspect-ratio: 16 / 9;" src="https://www.youtube.com/embed/Nm6PrkQgtzU" frameborder="0" allow="autoplay; encrypted-media" allowfullscreen></iframe> </div>Four paths from one set of facts
- The AI-native researcher gets a short comparison with sources, in structured text a system can quote, not a PDF gated behind a form.
- The technical evaluator gets an appendix with the implementation timeline, integration limits, and the cost model.
- Procurement gets independent reviews, referenceable customers, and security documentation that loads without a sales call.
- The senior executive gets a 20-minute walkthrough with a human who can answer the question the summary couldn't.
Tag win and loss notes by discovery channel and by role for one quarter. If AI-sourced opportunities stall, change the landing page, the case format, or the leave-behind for that path only. Keep conventional media running. Replacing it with AI-only pages abandons the half of the committee that never opened a chatbot. A B2B content marketing strategy that assumes one entry point is now a single point of failure.
Build the Dashboard and the AI Map
A competitive dashboard is a short list you can argue with on Monday morning, not a wall of channel charts nobody defends.
Track five numbers by cohort. Share of the searches and questions that match buying intent. Qualified pipeline or margin after acquisition cost. Payback. Win rate. Retained revenue. Add one incrementality read so retargeting can't masquerade as new demand. Five numbers, one owner, one argument.
| Read | What to record | Decision it forces |
|---|---|---|
| Share of buying-intent searches and questions | Your share versus the rivals buyers actually compare | Fund the question where a rival owns the shortlist |
| Qualified pipeline or margin after acquisition cost | Cohort result after a holdout, fully loaded | Scale only demand that would not have happened anyway |
| Payback | Months to recover acquisition cost on gross margin | Stop the segment that misses the cohort rule |
| Win rate | By claim and by proof path | Kill the line if clicks rise and wins do not |
| Retained revenue | Repeat, expansion, and save-offer margin | Fund retention before the next awareness burst |
| AI citation | Which rival is cited, which third parties feed it, which comparison is wrong | Earn one verifiable external proof point |
The citation row is a pipeline check
Most playbooks still treat classic search, paid, and share of voice as the whole battlefield. Buyers already compare vendors inside generative tools. A 2025 survey of 400 senior marketing executives in North America and Europe found that AI-native platforms such as ChatGPT and Perplexity represented 34% of qualified leads attributed to AI-search platforms, second to social media at 46% and ahead of organic search, email, and paid media, per the study reported by Businesswire. Only 11% of respondents said 75 to 100% of their content was ready for that discovery.
The same analysis found that 85% of brand mentions in early commercial AI searches came from third-party domains, while product content accounted for 56% of cited B2B material. Read that twice. The answer about you is mostly written by sources you don't own. So the strategic question isn't how to optimize for AI search. It's how to win when reviewers, communities, partners, and independent media write the sentence a system repeats about you.
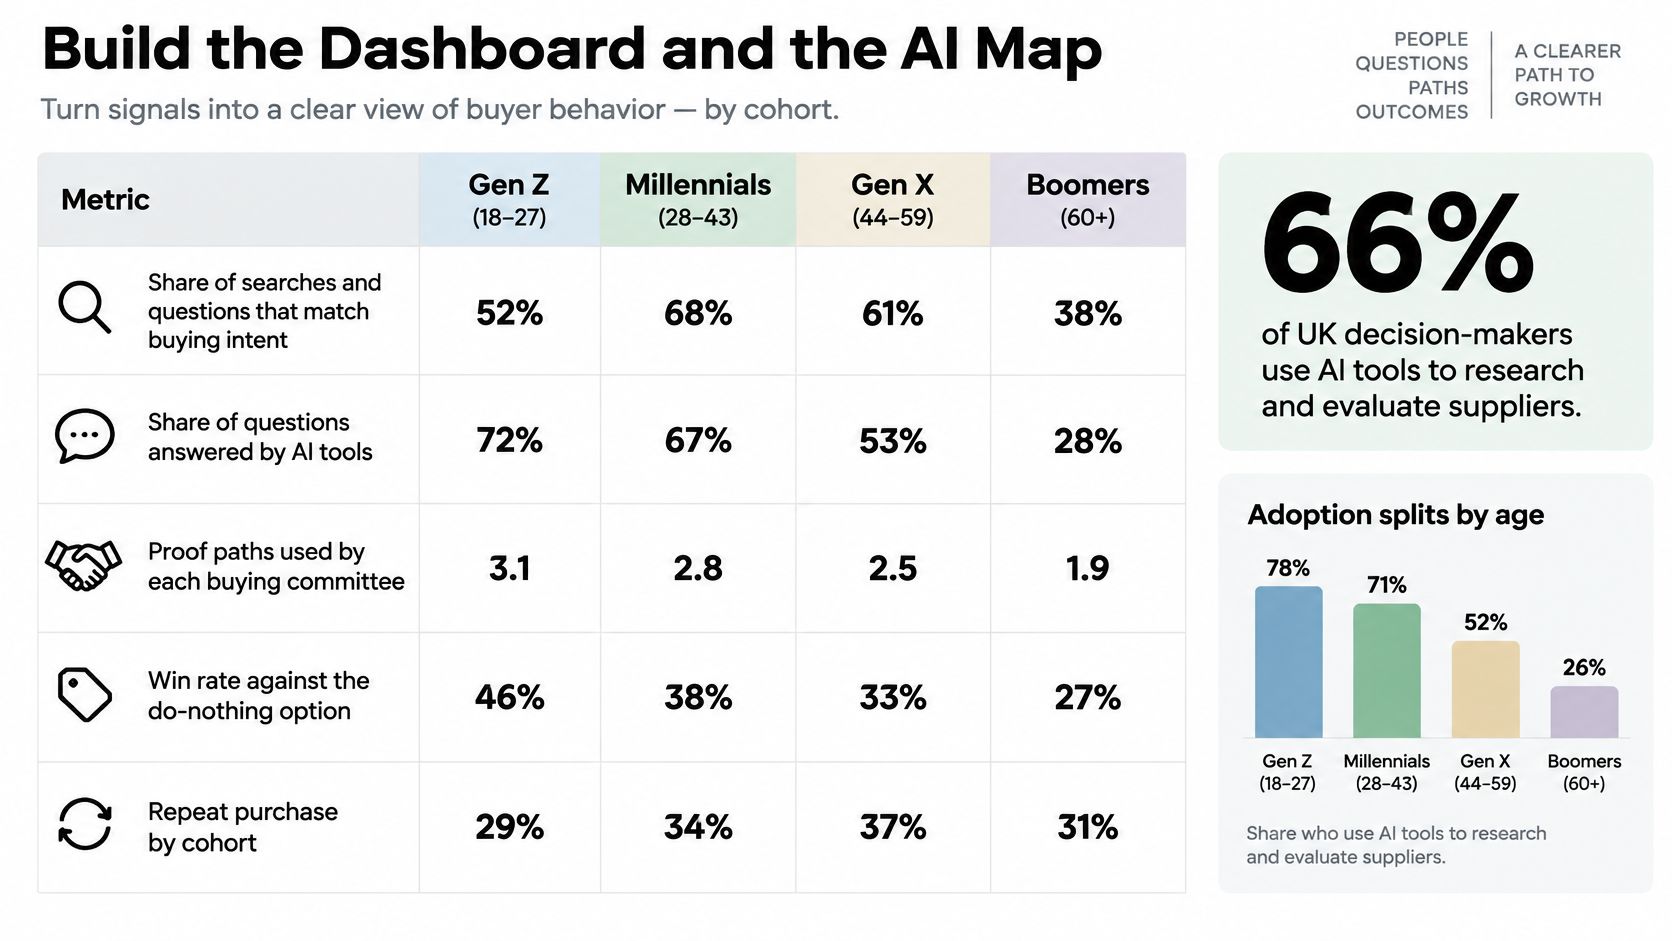
Build the map for your category: which rivals get cited, which sources feed those citations, which buyer questions produce a wrong comparison, and what evidence would change the answer. Review it monthly next to win rate. Then earn the citation rather than buying more owned pages.
One more number explains why this stays broken. Nielsen's 2025 Annual Marketing Report, based on a survey of 1,400 marketing professionals, found that only 32% of global marketers said they measured media spending across digital and traditional channels together. Put paid, organic, email, social, and AI-referred demand on the same five numbers and a single channel chart can't win the Monday argument. A marketing analytics dashboard built on those five reads beats any report with forty tabs.
Prioritize Experiments Across the Funnel
Fund the segment, not the channel with the prettiest dashboard. Channel-level performance is a story about the past. Incremental customer economics is the only thing that tells you where the next euro goes.
Start by splitting customers into acquisition cohorts. Calculate fully loaded acquisition cost, lifetime value after gross margin, payback, and retention for each cohort. Then compare those cohorts with rivals on the signals you already collected. Scale only where lifetime value to acquisition cost and payback stay acceptable after an incrementality check, as Contentmation's retention statistics breakdown puts it. Winning a new customer can cost 5 to 25 times more than keeping one, and a 5% retention improvement has been associated with a 25 to 95% increase in profit depending on industry economics. Treat those ranges as directional. They move with purchase frequency, contract length, and how you measure.
| Stage | First experiment | Metric that decides | Stop when |
|---|---|---|---|
| Awareness | One proof asset aimed at the highest-scoring force | Assisted pipeline or qualified visits from that asset | Spend rises and qualified demand does not |
| Acquisition | One buying-intent campaign tied to the falsifiable claim | Incremental qualified pipeline or margin after acquisition cost | Payback misses the cohort rule after holdout |
| Activation | Remove the step where new users stall in week one | Time to first value and activated rate | Activation is flat after one clean test |
| Revenue | Offer and proof on the page where deals or carts die | Win rate or completed-order rate, not clicks | Early clicks rise and closed revenue does not |
| Retention | One save or repeat offer for a named churn cohort | Retained margin and repeat rate | The offer discounts revenue you would have kept |
| Referral | Ask only customers who already repeated | Referred revenue that stays past the first order | Referrals are cheap leads that never buy again |
Match the test to the leak you can see
For pipeline businesses, put activation, expansion, referral, and churn tests next to acquisition, not after the paid budget is gone. For stores, put a repeat-purchase test beside the next prospecting push. One new test a month beats six changes in one week you can't attribute.
Then get specific about the leak. A B2B team can map one high-value offer with no salesperson in the room: problem, comparison, pricing, implementation, security, proof, demo booking. In a McKinsey survey of B2B decision makers, 99% said they would make a purchase through an end-to-end digital self-service model, and most were comfortable spending at least $50,000 online. Track where prospects stop and add a human only there.
Search campaigns have three levers worth pulling. Google's own Quality Score documentation calls it a diagnostic of expected click-through rate, ad relevance, and landing-page experience, not an input in the ad auction. So build one tightly themed ad group around one intent, repeat that intent in the ad, and answer it above the fold. Change one factor, then look at the three component ratings separately.
For e-commerce, checkout friction beats most acquisition ideas. Baymard's checkout usability research reports a global average cart-abandonment rate of 70.19%, with 48% of shoppers leaving because extra costs were too high, 24% because the site required an account, and 17% because checkout was too complicated or long. Show shipping and tax before payment, offer guest checkout, and count fields. The average U.S. checkout carries 23.48 default form elements against an ideal of 12 to 14.
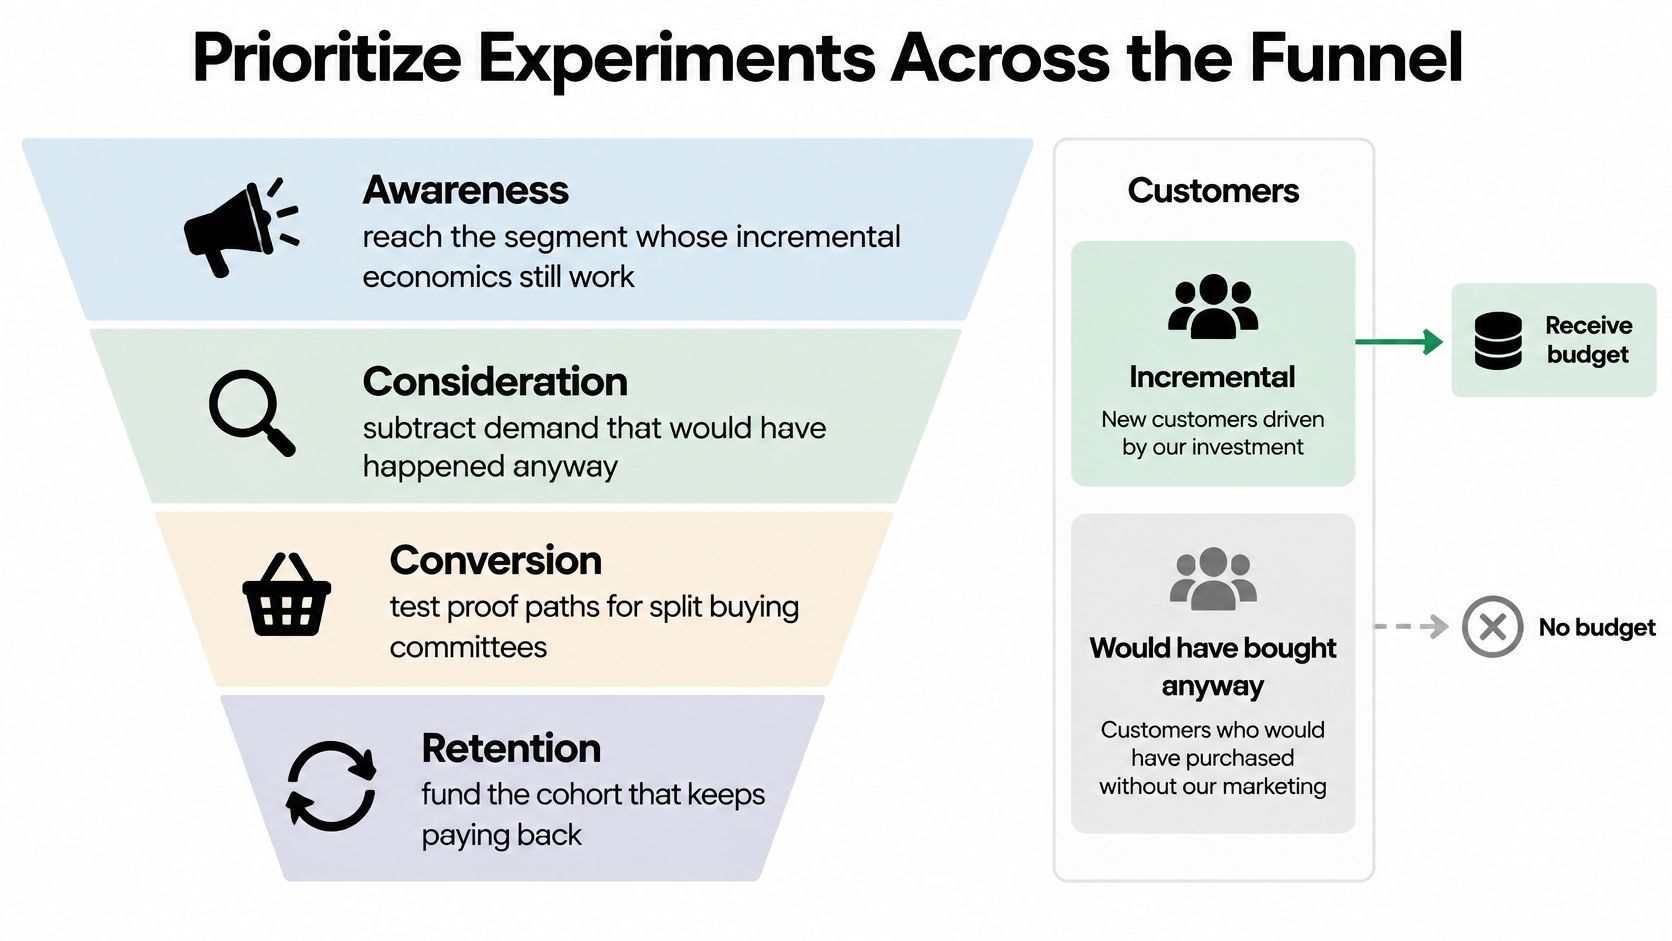
Four traps sit beside this: blended acquisition cost, ignoring gross margin, treating retargeting conversions as fully incremental, and optimizing for form fills instead of qualified pipeline or retained revenue. A disciplined A/B testing for marketing programme fixes all four, because every test carries a stop rule instead of an opinion.
Run One Bottleneck Sprint This Month
Pick the highest five-force score, the claim a lost deal can falsify, and the one funnel stage whose stop rule is already written. That trio is the month. Freeze every other test so the result has exactly one cause.
On Monday, hold a 90-minute working session. Confirm the competitive set is still the three options buyers compare, including do-nothing and a substitute from another category. Lock the primary metric, the minimum lift, and the date you'll stop. Name one owner for the proof path the stalled role uses: a sourced comparison, a technical appendix, an independent review, or a human walkthrough.
By Friday, ship one change. A page, a sales leave-behind, a retention offer for a named cohort, or a third-party citation you can verify.
Read the result on share of buying-intent questions, qualified margin after acquisition cost, payback, win rate, and retained revenue. If pipeline quality is the bottleneck, connect spend to qualified outcomes before buying more reach. If repeat revenue is the bottleneck, run the retention test before the next awareness burst. If AI-sourced deals stall, change only that path.
A strategy you can't kill in thirty days is a poster. The work that holds up is narrower and faster: Sprints & Sneakers runs growth strategy, performance marketing, and GEO in sprints accelerated by AI, with a brand strategy service that includes market and competitor analysis and an ICP refinement service that ends in a messaging matrix.
If the five-force score points at one force and the audit sentence names a proof gap, one sprint is enough to find out whether the market will pay for the claim. Sprints & Sneakers builds that rhythm for B2B and B2C teams: cohort economics, proof paths per role, and GEO visibility tested against pipeline rather than impressions. Bring one core offer and next quarter's budget question to a growth scan, and leave with the single bottleneck worth a month.
Related articles


Frequently asked questions
Growth marketing, AI and automation, SEO, performance marketing, retention strategies, and sustainable business practices.
Weekly. Subscribe to our newsletter to get new articles straight to your inbox.
Absolutely. Everything we publish is designed to be actionable. Take it, test it, and make it your own.
Yes. We publish experiments with real numbers. What worked, what didn't, and what we learned.
Our growth team — strategists, performance marketers, data specialists, and AI builders who work on client campaigns every day.
We're open to it. Reach out via our contact page with your topic and we'll take a look.