
Customer Behavior Analysis That Drives Full-Funnel Growth
Learn how customer behavior analysis turns real user signals into pipeline, retention, and revenue wins for B2B and B2C growth teams.
The dashboard is green. Traffic looks steady. Demo requests haven't collapsed. Product usage still shows activity. Yet qualified pipeline is thinning out, sales cycles are getting less predictable, and renewal conversations feel harder than they did a quarter ago.
That's where teams realize they don't have a reporting problem. They have a customer behavior analysis problem.
Too many companies treat behavior analysis like a pile of charts. The useful version is different. It helps a team decide what to change first, which segment deserves attention now, and where one experiment can drive movement across the funnel instead of polishing a metric no buyer cares about.
Table of Contents
- What Customer Behavior Analysis Really Means in 2026
- Why Full-Funnel Growth Depends on Behavior Signals
- Quantitative and Qualitative Methods Working Together
- Key Metrics and Data Sources by Funnel Stage
- A Repeatable Workflow for Analysis and Experimentation
- B2B and B2C Examples You Can Apply Tomorrow
- Privacy, the Listening Gap, and What to Do Next
What Customer Behavior Analysis Really Means in 2026
A lot of teams still confuse customer behavior analysis with web analytics. That mistake gets expensive fast.
Web analytics tells a team what happened. Voice-of-customer research tells a team what customers say. Customer behavior analysis combines actions, context, and feedback so a business can decide what to do next. It looks at how people discover, evaluate, buy, use, expand, and leave, then turns those signals into priorities.
From measurement to decisions
This isn't a new discipline dressed up with new labels. Customer behavior analysis has roots in long-running measurement programs. The University of Michigan's Survey of Consumer Attitudes and Behavior began in the late 1940s, ran quarterly through 1977, and has been fielded monthly since then with the explicit goal of linking consumer expectations to decisions about saving, borrowing, and discretionary purchases, as described in this overview of consumer behavior measurement history.
That history matters because the underlying logic hasn't changed. Observe behavior. Understand motivation. Connect both to likely future action.
What has changed is the environment. In 2026, the strongest programs rely on first-party data, server-side tracking, modeled conversions, consented inputs, and tighter governance because the old third-party shortcut isn't reliable anymore. Teams that want a practical view of that shift should review this guide to marketing tracking and analytics in 2026.
Practical rule: If a team can't name the decision a dashboard supports, that dashboard is probably noise.
What it includes, and what it doesn't
Useful customer behavior analysis usually pulls from several layers:
- Observed actions: Page views, feature use, return visits, search behavior, checkout actions, and usage frequency
- Lifecycle context: Lead status, trial stage, account health, renewal timing, order cadence, and repeat purchase windows
- Direct feedback: Survey responses, support conversations, cancellation reasons, and chat transcripts
That mix is what separates behavior analysis from isolated reporting. A pricing-page visit means one thing for a first-time visitor and another for a buyer returning after a support issue. Context changes interpretation.
The traps that derail most programs
Three traps show up constantly.
- Over-instrumentation: Teams capture everything and learn nothing.
- Vanity dashboards: Reports look polished but don't influence targeting, onboarding, pricing, or retention plays.
- Analysis paralysis: Everyone waits for perfect certainty while churn, drop-off, or discounting keeps moving.
The teams that get value from customer behavior analysis keep the bar simpler. They start with a narrow business question, gather the signals tied to that question, and move quickly to a test.
Why Full-Funnel Growth Depends on Behavior Signals
Growth doesn't break in one place. It leaks between stages.
A campaign brings in attention, but the wrong visitors bounce after shallow content engagement. Paid traffic converts to trials, but weak setup behavior predicts poor activation. Product usage looks healthy at account level, but support signals say renewal risk is climbing. Each of those moments is behavioral. Each affects the next stage.
Early-stage behavior often tells more than audience labels. Scroll depth and content consumption patterns can reveal whether a visitor is learning, comparing, or skimming. Demographic targeting rarely catches that nuance.
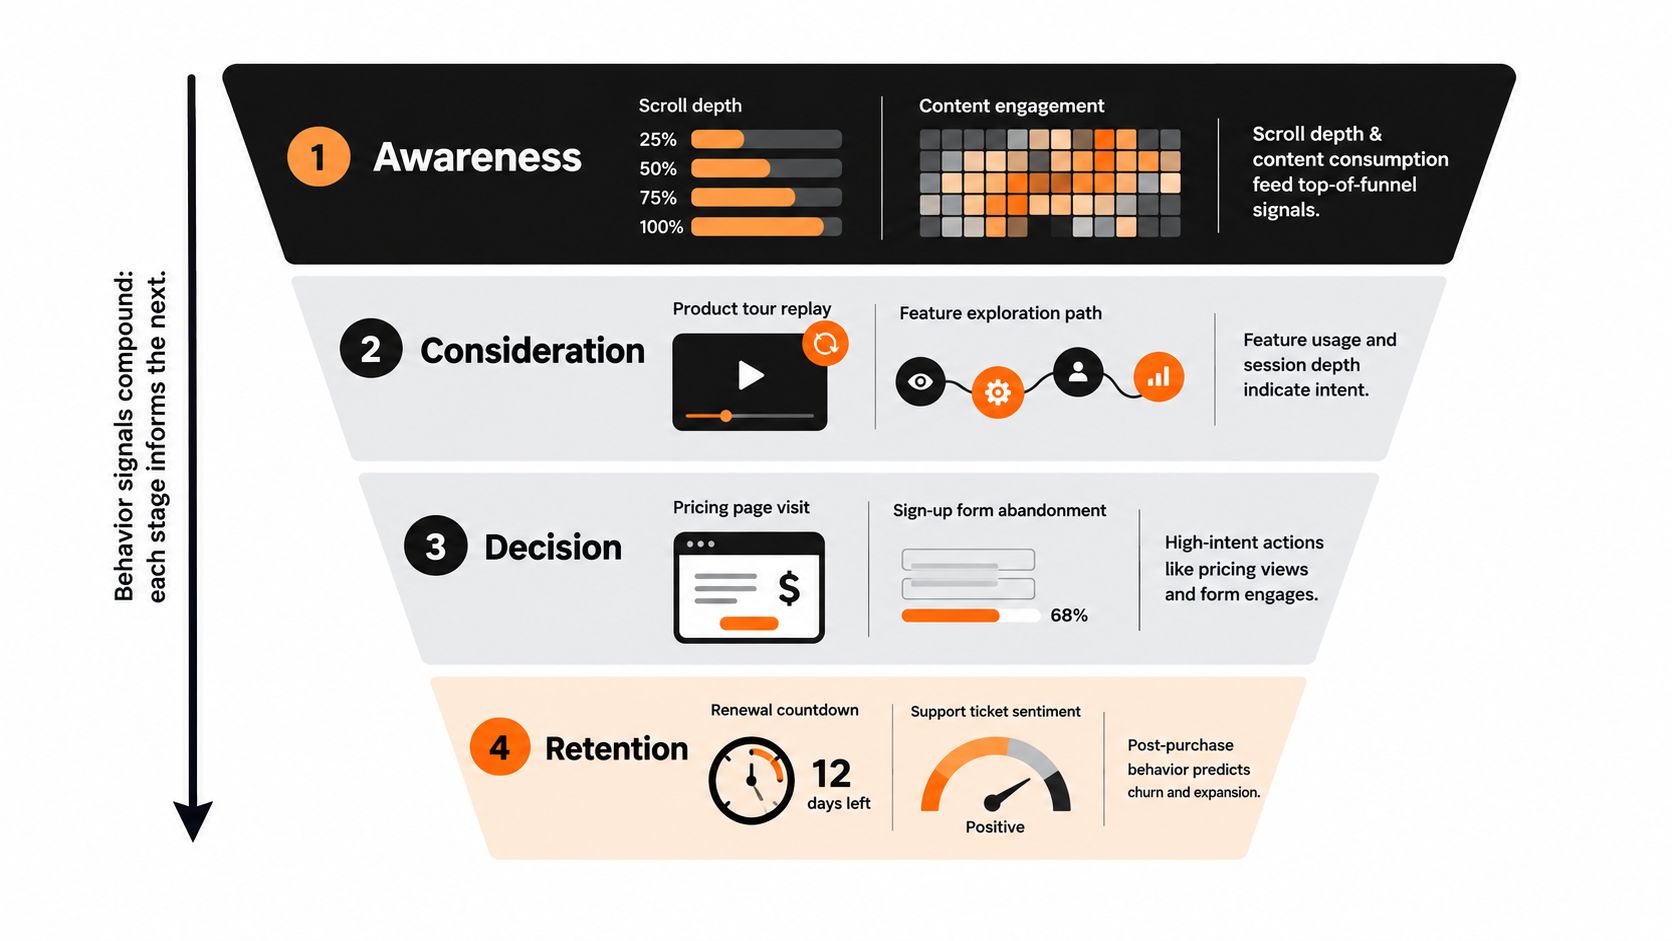
Signals that matter at each stage
For teams building a stronger full-funnel marketing strategy, the key is to read behaviors as handoff signals rather than isolated metrics.
- Awareness: A visitor who reaches key sections, returns to related content, or consumes comparison material behaves differently from a casual click.
- Acquisition: Post-click behavior often reveals more than channel reports. If visitors from one paid search theme repeatedly explore product pages, pricing interactions, and comparison content, that traffic may be worth more than another keyword that looks efficient on the ad platform but produces weak downstream intent.
- Activation: Signup volume can hide poor fit. Event sequences in the first days of product use often tell a clearer story about whether a user is heading toward value.
- Revenue: Feature depth, repeated use of higher-value workflows, and pricing-page revisits can point to expansion readiness or discount sensitivity.
- Retention: Declining usage paired with support friction is often the warning sign that matters most.
- Referral: Advocacy usually follows habit, not enthusiasm alone.
A simple visual helps show how these stages connect.
<iframe width="100%" style="aspect-ratio: 16 / 9;" src="https://www.youtube.com/embed/VWI8wl4KsFs" frameborder="0" allow="autoplay; encrypted-media" allowfullscreen></iframe>Why compounding matters
The biggest mistake is treating each funnel stage as its own reporting island.
When awareness signals improve audience quality, acquisition gets easier. When acquisition quality improves, activation data gets cleaner. When activation gets stronger, revenue and retention become less dependent on discounts and rescue work. That's why behavior analysis compounds. It doesn't just improve one conversion point. It sharpens every downstream decision.
A team that skips behavior signals at the top usually ends up paying for the same mistake again in onboarding, again in retention, and again at renewal.
Referral deserves one caution. It's tempting to chase advocacy too early. But promoter scores alone don't create referrals. The more reliable trigger is promoter sentiment paired with real product habit. When someone reaches a clear power-user threshold, referral motions usually work better than when teams blast every “happy” customer the same ask.
Quantitative and Qualitative Methods Working Together
The strongest customer behavior analysis programs don't argue about quant versus qual. They use both.
Quantitative methods show where the pattern is. Qualitative methods explain why the pattern exists. One without the other creates blind spots.
What each method is good at
A useful way to think about it is simple. Quantitative analysis tells a team which door customers left through. Qualitative analysis tells a team why they walked toward it in the first place.
On the quantitative side, the core toolkit usually includes event analysis, funnel views, cohort comparisons, and segmentation models. One practical framework is RFM segmentation, which scores recency, frequency, and monetary value on a 1-to-5 scale, usually with quantiles that divide customers into five equal groups or with business-defined thresholds. It commonly uses a 12-month window and labels combinations such as 555 for champions and 111 for lost customers, as outlined in this guide to RFM-based customer behavior analysis.
On the qualitative side, the most useful inputs are usually short in-product surveys, exit questions, support ticket review, sales call notes, session observation, and chat transcripts. Teams that need a stronger foundation in structured measurement can borrow from the discipline used in quantitative marketing research.
Quantitative vs Qualitative Methods for Behavior Analysis
| Method | Effort | Sample Needed | Time to Insight | Bias Risk | Best Funnel Stage |
|---|---|---|---|---|---|
| Event and funnel analysis | Medium | Higher | Fast once tracking is clean | Lower interpretation bias, higher instrumentation risk | Acquisition, activation, revenue |
| Cohort analysis | Medium | Higher | Medium | Moderate if cohorts are poorly defined | Activation, retention |
| RFM segmentation | Low to medium | Moderate transaction history | Fast | Lower bias if definitions are stable | Revenue, retention |
| In-app micro-surveys | Low | Smaller | Fast | Higher self-report bias | Activation, retention |
| Exit interviews | Medium | Smaller | Medium | Higher recall bias | Churn, retention |
| Support ticket mining | Medium | Moderate | Medium | Moderate tagging bias | Retention, expansion |
| Session review | Medium | Smaller | Fast to medium | Observer bias | Acquisition, activation |
Tight loops beat giant research projects
Most teams wait too long to connect these methods.
A better loop looks like this:
- Quant finds the anomaly. A segment stalls during setup, abandons the same step, or stops using a key workflow.
- Qual explains the friction. Support notes, survey answers, or observed sessions reveal confusion, mistrust, or missing expectations.
- An experiment tests the fix. Messaging, onboarding, page design, or lifecycle timing changes based on that evidence.
That loop is what makes customer behavior analysis commercially useful. Without it, quant becomes passive reporting and qual becomes a pile of anecdotes.
Key Metrics and Data Sources by Funnel Stage
Instrumenting too broadly at the start is a common misstep. Teams wire up dozens of events, then realize none of them map cleanly to a decision.
A better approach is to instrument by funnel stage and by influence. Start with the signals that help a team act. Add detail later.
What to wire up first
The most valuable first layer usually includes website and app analytics, order history, chatbot or live chat logs, support tickets, CRM or lifecycle status, and on-site search data. That multi-source workflow is useful because it helps answer one narrow question at a time, such as where a funnel leaks or which segment is approaching churn, as described in this practical guide to combining customer behavior data sources.
| Funnel Stage | Key Metrics | Data Source to Instrument First | Secondary Signal |
|---|---|---|---|
| Awareness | Scroll depth, content engagement, source attribution | Website session events and landing page paths | On-site search terms |
| Acquisition | Form starts, form completion, high-intent page views, assisted conversions | CRM lead records tied to visit behavior | Chat questions before conversion |
| Activation | Setup completion, time-to-first-value, first key action | Product event stream | Onboarding support interactions |
| Revenue | Upgrade path entry, pricing-page revisits, discount dependence | Billing and CRM opportunity stage changes | Feature depth before purchase |
| Retention | Usage frequency over time, return behavior, churn reasons | Product usage plus support tags | Renewal timing and ticket language |
| Referral | Invite actions, review prompts completed, advocacy by cohort | Referral event tracking | Post-purchase survey themes |
Instrumentation priorities that actually help
For most B2B and B2C teams, the first pass should focus on a short list:
- Activation events: The actions that mark first real value, not just account creation
- Lifecycle stage changes: Lead, trial, active, at-risk, renewing, expanded, canceled
- Support signals: Reason codes, themes in verbatim feedback, and escalation type
- Commerce or revenue actions: Repeat purchase, upsell path entry, discount use
- Search and discovery behavior: What people look for before they convert or drop
This matters for content-heavy businesses too. Teams working on audience growth or monetization can study how helps creators frame behavioral signals around engagement paths and audience actions, then adapt that thinking to their own funnel.
The common mistake isn't missing one exotic metric. It's relying on a general traffic dashboard when the real predictors of retention live in product, CRM, and support data.
A good reporting layer should make these signals visible, but visibility alone isn't enough. Teams that need cleaner operating views usually benefit from simpler marketing reporting dashboards built around decisions, not every available field.
A Repeatable Workflow for Analysis and Experimentation
Behavior analysis and experimentation often sit in separate lanes. One team builds reports. Another team runs tests. The result is slow learning and a backlog full of ideas with no ranking logic.
The better model is one operating loop.
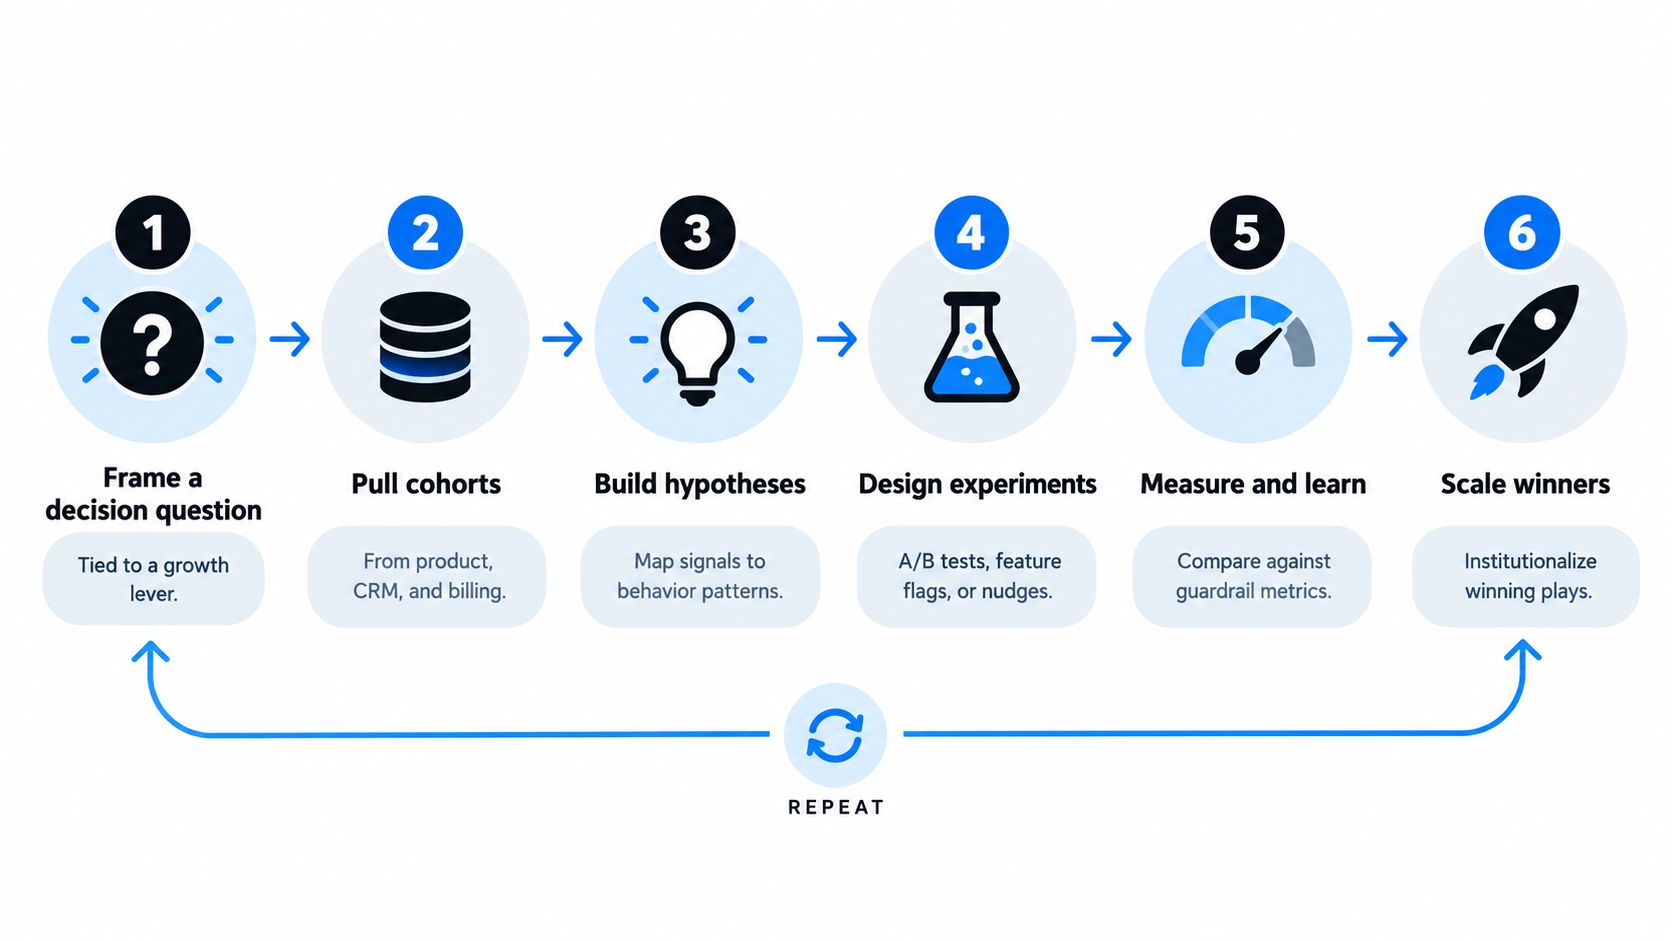
The six-step loop
-
Frame one decision question
Tie it to a growth lever. “Why do trial users stall before first value?” is useful. “What's happening in onboarding?” is too broad. -
Pull the right cohorts
Bring together the records connected to that question. Product events. CRM stage. Billing status. Support history. Nothing else. -
Segment before diagnosing
RFM works well for transaction-heavy models. Behavioral clustering works well when usage patterns differ sharply across customer types. The point isn't elegance. It's separating unlike users before drawing conclusions. -
Write a falsifiable hypothesis
A strong hypothesis links signal, mechanism, and expected movement. If declining usage before renewal signals weak habit, then proactive guidance and outreach should improve save outcomes relative to the current motion. -
Run a controlled test with guardrails
Guardrails matter because local wins can create downstream damage. A stronger conversion prompt that increases low-fit signups may hurt retention later. -
Codify the learning
Winning tests should become operating plays. Losing tests should still produce rules about segment fit, timing, or messaging.
Why churn triage should feed the backlog
One practical use case stands out in SaaS. A segment with steadily declining login frequency can act as an early warning sign, especially when paired with time to renewal. That allows teams to intervene before the account is already gone, as shown in this example of usage-frequency-based churn prevention.
That same triage logic improves experimentation. Instead of treating the backlog like a static list, teams can re-rank it weekly based on fresh risk signals. If one cohort shows sharper usage decay, rising support friction, or weaker repeat behavior, that cohort moves up.
What makes this workflow work
The hidden advantage of this model is operational. It reduces the gap between insight and action.
A lot of organizations collect behavioral data but still don't connect it to direct feedback or move quickly enough to respond. Independent reporting on the widening customer listening gap in digital experiences captures the problem well. Teams know what users did, but not why they did it, or who owns the fix.
Better customer behavior analysis usually comes from tighter ownership, not from adding another dashboard.
B2B and B2C Examples You Can Apply Tomorrow
The framework stays the same across business models. The playbook changes.
One signal can lead to two very different actions depending on buying cycle, account structure, margin model, and how quickly the team can intervene.
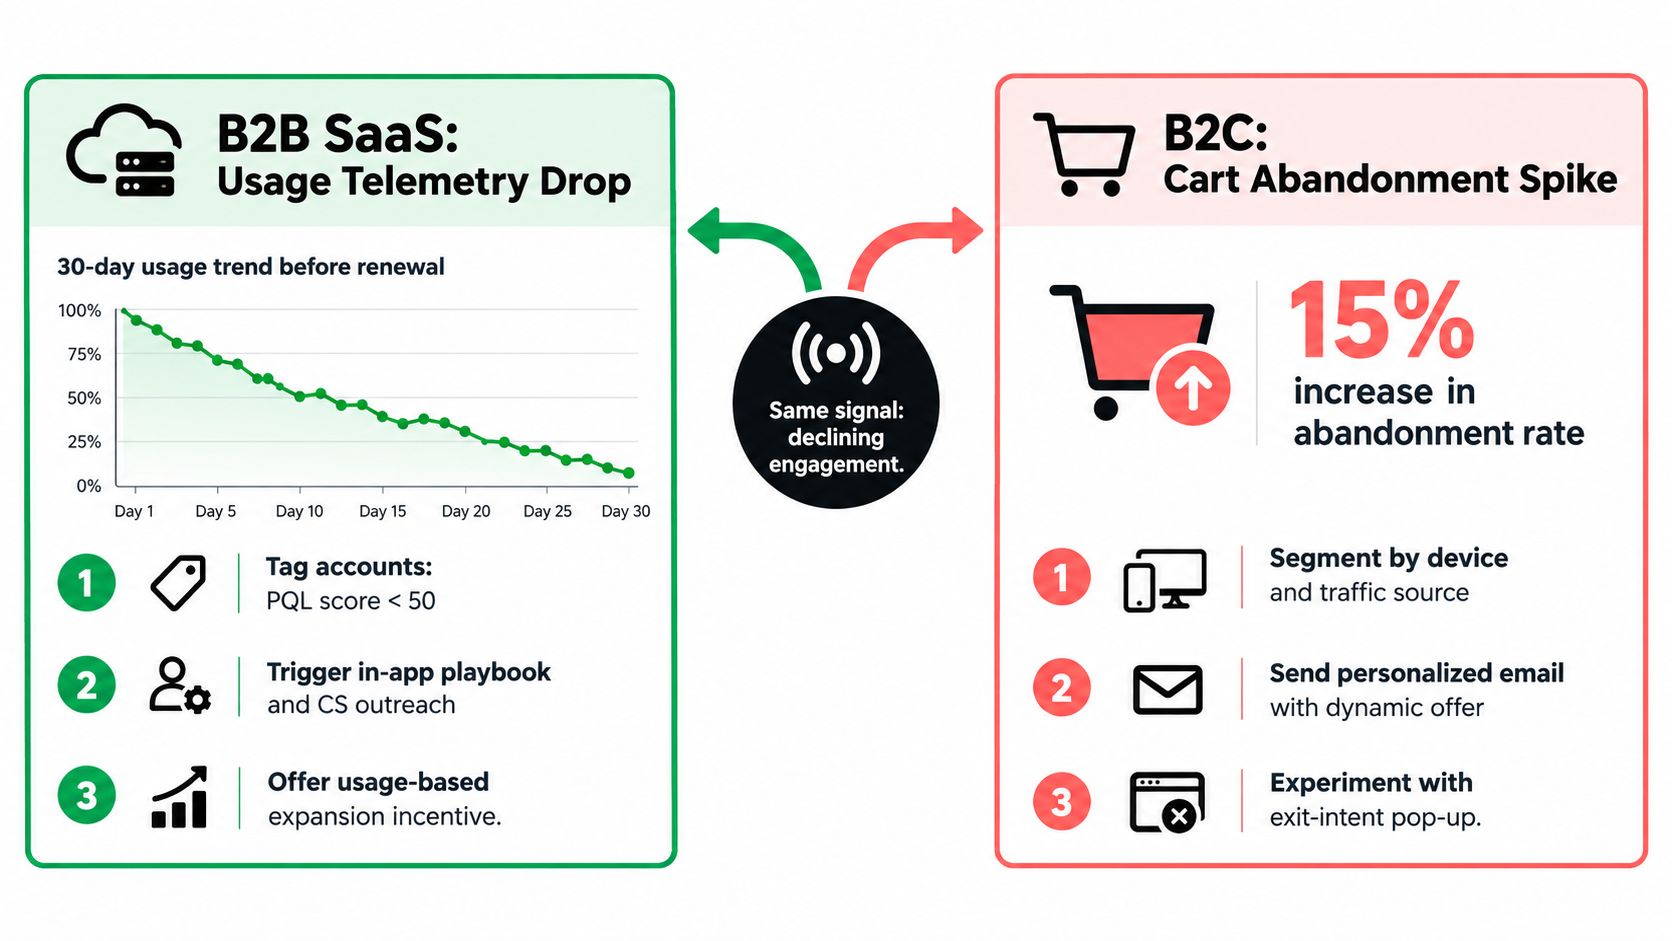
B2B SaaS example
Start with a familiar signal. Usage telemetry drops before renewal.
The useful response isn't a generic health score alert. It's a tighter sequence:
- Identify the at-risk cohort: Accounts with falling usage frequency, renewal approaching, and weak adoption of core workflows
- Add lifecycle context: Separate strategic accounts from low-fit accounts so customer success doesn't spend the same energy on both
- Trigger a save motion: Route the segment into proactive outreach, in-app guidance, and a success plan tied to the feature path they've underused
- Test the intervention: Compare a targeted onboarding nudge and guided usage path against the current renewal motion
The point is timing. If the account team waits until the renewal conversation is already tense, behavior analysis arrived too late.
B2C DTC example
Now use the same thinking in a repeat-purchase business.
The signal is different in form but similar in meaning. A cohort of one-time buyers approaches the point where a second purchase usually should have happened, yet they haven't returned.
The response can look like this:
- Build the cohort: One-time buyers grouped by product category, margin profile, and purchase timing
- Look for path differences: Which visitors return to browse but don't purchase, which open emails but don't click, which search for adjacent products
- Launch a behavior-based retention play: Send personalized bundle suggestions or replenishment reminders based on what they browsed and bought
- Test against a discount control: Measure repeat behavior and margin quality, not just click rate
The shared lesson
Both examples rely on the same core logic. Watch for a change in behavior. Add context. Segment. Intervene before the customer is fully gone.
Where they differ is cadence. B2B teams often have fewer accounts, higher stakes, and more room for human intervention. B2C teams usually need tighter automation, clearer merchandising logic, and faster creative iteration.
When that distinction is ignored, teams copy tactics across models and wonder why they don't travel well.
Privacy, the Listening Gap, and What to Do Next
The next phase of customer behavior analysis will reward teams that collect less junk and make better calls.
That's uncomfortable because many growth organizations still operate like more events automatically mean more insight. In practice, fragmented signals, weak consent, and unclear ownership create bloated analytics setups that don't improve decisions.
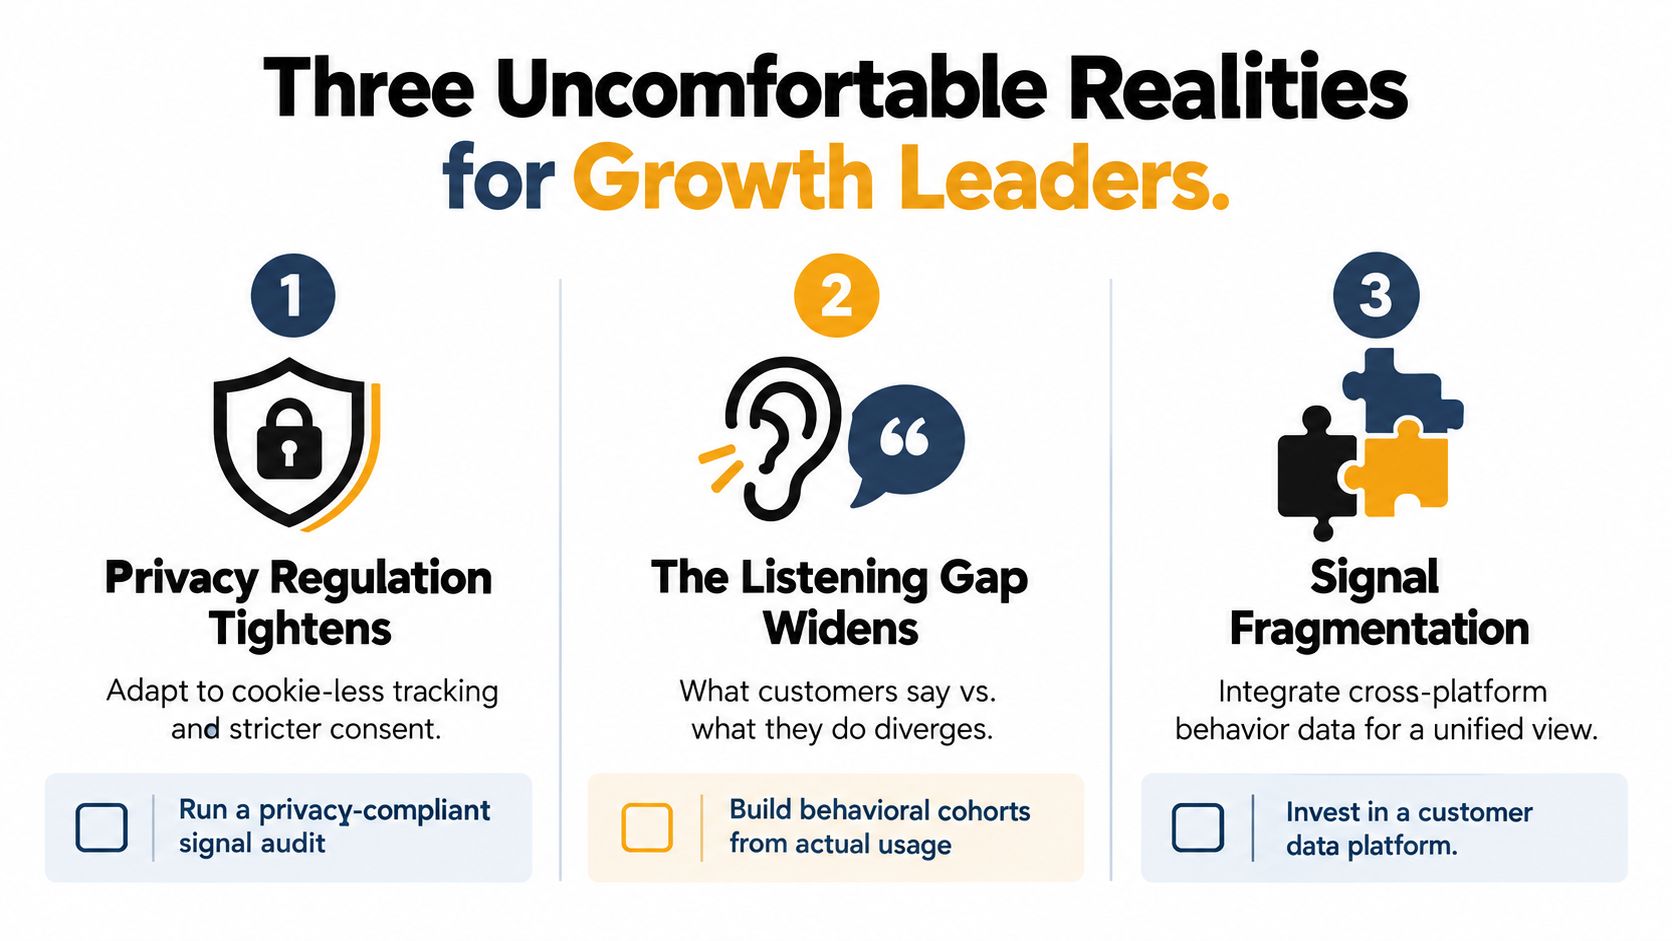
The privacy-first reality
Post-cookie behavior analysis is forcing a reset. Third-party tracking is shrinking, privacy regulation is tightening, and teams are moving toward first-party, consent-based, cross-functional governance models. At the same time, changing consumer context matters. One recent summary notes that in 2025 US consumers spent nearly 90% of extra free time on solo activities and that 47% of global consumers consider locally owned companies important to purchase decisions, as discussed in this guide to privacy-first customer behavior analysis.
That shift changes the job. Teams can't assume rich identifiers everywhere, so they need stronger event design, better consent handling, and more thoughtful use of direct customer input.
Fewer events, better decisions
A good analysis setup doesn't need hundreds of noisy events. It needs the right ones.
For leaders reviewing their current stack, a practical audit should ask:
- Which events map to a real decision: Activation, pricing friction, expansion readiness, churn risk, referral habit
- Which fields create context: Lifecycle stage, plan type, support reason, renewal date, repeat purchase window
- Which feedback loops explain behavior: Survey answers, cancellation reasons, support verbatims, chat themes
For teams formalizing that approach, a clear first-party data strategy is usually more valuable than adding another tracking layer.
The quality of customer behavior analysis is mostly the quality of the decisions it helps a team make.
The next moves that matter
A practical next-week plan is enough to reset the program:
- Audit current instrumentation and remove events nobody uses.
- Define three funnel questions that matter now, not someday.
- Pick one segment where behavior changed recently.
- Run one experiment tied to that signal.
- Assign one owner for a weekly analysis cadence.
The tooling categories are straightforward. Teams need a way to read product behavior, observe sessions, gather feedback, manage customer records, and unify data where needed. The specific tool matters less than the workflow holding it together. If that workflow support is missing, one option is Sprints & Sneakers, which provides full-funnel growth support spanning analytics, experimentation, CRM, retention, and lifecycle decision-making for B2B and B2C teams.
Customer behavior analysis becomes valuable when a company stops admiring the data and starts using it to choose.
Sprints & Sneakers helps growth teams turn messy funnel data into focused experiments across awareness, acquisition, activation, revenue, retention, and referral. If customer behavior analysis is producing dashboards but not decisions, visit Sprints & Sneakers to see how a more disciplined full-funnel approach can tighten pipeline, improve retention, and create a clearer growth operating system.
Related articles

Frequently asked questions
Growth marketing, AI and automation, SEO, performance marketing, retention strategies, and sustainable business practices.
Weekly. Subscribe to our newsletter to get new articles straight to your inbox.
Absolutely. Everything we publish is designed to be actionable. Take it, test it, and make it your own.
Yes. We publish experiments with real numbers. What worked, what didn't, and what we learned.
Our growth team — strategists, performance marketers, data specialists, and AI builders who work on client campaigns every day.
We're open to it. Reach out via our contact page with your topic and we'll take a look.