
Digital Growth Marketing: A Full-Funnel Guide for 2026
Digital growth marketing explained: the full-funnel framework, experiment priorities, impact measurement, AI tactics and a checklist you can use tomorrow.
The weekly report lands and the numbers look fine. Sessions are up, cost per click is down, and the team hit its lead target for the fourth month running. Then someone asks whether any of it turned into revenue, and the room goes quiet.
That silence is the most common symptom in growth work. Traffic is rarely the constraint. The constraint sits one or two steps further along, in the handoff between a lead and a first real conversation, in a trial that never reaches its first useful result, or in the second purchase that never happens.
Digital growth marketing is the discipline that treats the whole journey as one system and tests each stage instead of buying more traffic. What follows walks through all six stages, shows where each business model leaks, and hands over the scoring method and measurement rules that keep the next experiment honest.
Table of Contents
- What Digital Growth Marketing Means and Where Each Stage Fits
- How the Model Changes for B2B, B2C and SaaS
- How to Measure Impact Without Fooling Yourself
- How to Prioritize Growth Experiments That Pay Off
- AI Tactics That Work and the Points Where to Stop Automating
- Three Growth Cases You Can Copy Next Week
- Run Your First Growth Experiment This Week
What Digital Growth Marketing Means and Where Each Stage Fits
Say a subscription skincare brand doubles its paid social budget for a quarter. Traffic climbs with it, cost per click holds steady, and the team celebrates a record month of clicks. Three months later revenue has barely moved, because most new buyers purchase once, open two emails and drift away. The business paid more to fill a tub with the plug out.
Acquisition is the faucet. Churn is the drain. The water level, which is growth, rises only when inflow beats outflow, so turning the tap harder while the drain stays open wastes water and budget in exactly the same way.
The diagram below sets the stages against that tub, so you can see where the water goes.
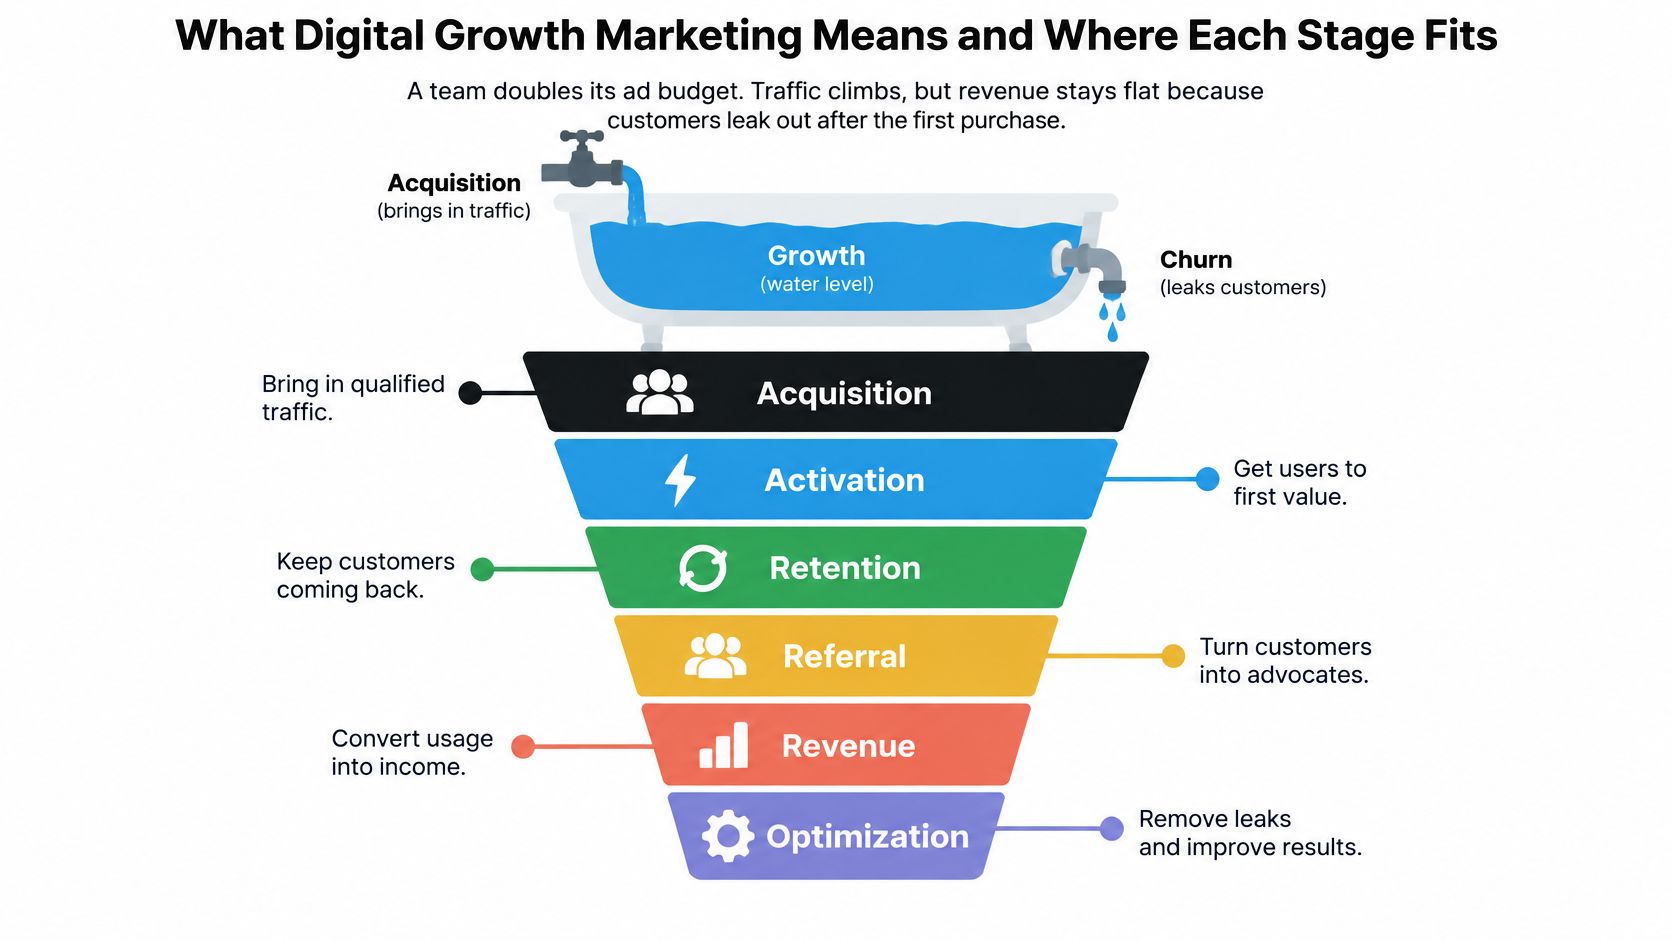
Digital growth marketing means running every stage of the customer journey as one connected system, testing and measuring each stage rather than buying traffic and trusting the rest to sort itself out. That definition sounds almost too plain. It isn't, because many teams still organise around channels and campaigns while the customer experiences one continuous path.
Six stages cover that path. Each has a question to answer, a number to watch and a lever to pull.
| Stage | Question it answers | Core metric | Typical lever |
|---|---|---|---|
| **Awareness** | Do people in our market know we exist? | Reach and branded search volume | Content, video and social presence |
| **Acquisition** | Do the right people click or enquire? | Cost per qualified visit or lead | Paid search, paid social and SEO |
| **Activation** | Do new users reach their first real value? | Activation rate within 7 days | Onboarding flow and first-session guidance |
| **Revenue** | Do visitors become paying customers? | Conversion rate and average order value | Checkout, pricing page and offer design |
| **Retention** | Do customers come back? | Repeat purchase rate and churn | Lifecycle email, loyalty and product updates |
| **Referral** | Do customers bring others? | Referral share of new customers | Incentives, shareable outputs and partner programs |
Read that table as a diagnostic order, not a menu. When traffic grows and revenue doesn't, the leak usually sits between activation and retention, and that's where the next experiment belongs. If you want to spot buyers who are already in-market before they ever click, LeadBeast's guide to intent based marketing shows how to read those signals without guessing.
Owning channels matters for a blunt commercial reason. WARC's global advertising forecast put worldwide advertising expenditure at roughly $1.07 trillion in 2024, up 10.5% year on year, and expected Meta, Amazon and Alphabet to capture more than 70% of incremental ad investment and 43.6% of global ad spend that year. WARC's advertising market analysis also forecast digital at just over 81% of total ad expenditure in 2025. Scale is available. The price and the rules of that scale belong to a handful of companies.
So the first job isn't picking a channel. It's finding the stage where water disappears fastest.
How the Model Changes for B2B, B2C and SaaS
Two companies can run the same six stages and need opposite first experiments. A scale-up selling six-figure software contracts and a webshop selling coffee pods both want revenue, but the stage eating their growth differs, and so does the evidence that settles the argument. That is why growth marketing runs as separate B2B and B2C funnels rather than one dashboard with two logos on it.
The table below maps the usual leak, the first experiment worth running and the number that proves or kills it.
| Business model | Usual leak point | First experiment | Primary metric |
|---|---|---|---|
| **B2B scale-up** | Between qualified lead and sales opportunity | Qualification questions on the inbound form | Pipeline created per account |
| **B2C ecommerce** | Checkout and first repeat purchase | Guest checkout versus forced account creation | Checkout completion and repeat purchase rate |
| **B2B SaaS** | Trial to paid activation | Guided onboarding checklist in the first session | Trial-to-paid conversion within 30 days |
| **Industrial B2B modernizing** | Awareness across a long buying cycle | Content aimed at a named target account list | Opportunities created from target accounts |
Why the SaaS row fools teams
B2B SaaS is the row teams misdiagnose most often, because the funnel delays the evidence. Trials start weeks before revenue appears, so a weekly report can celebrate rising signup volume while activation fails. The leak then gets filed under acquisition, since acquisition is where the names came from, and the team buys traffic to fill a funnel that cannot hold it.
Part of SaaS demand is also invisible by design. A buyer hears about the tool from a practitioner, watches it on a colleague's screen and reaches the trial already half-decided, while the dashboard records a single direct visit. Treat attribution in this row as a diagnostic pointer rather than proof of impact. The number that settles the argument is trial-to-paid conversion within 30 days, since signups and in-product page views can both climb while revenue stays flat. Sprints & Sneakers' SaaS growth strategy guide shows how to sequence activation work against acquisition spend so the two stop competing for the same budget.
SaaS teams also borrow trust from outside their own site. How SaaS influencer marketing works covers why practitioner voices travel further in a trial-heavy category than a brand account does, and where that channel stops paying off.
For the ecommerce row, scale explains why small fixes pay. UN Trade and Development's e-commerce statistics recorded nearly $28 trillion in e-commerce sales across 46 developed and developing economies in 2024, roughly three-quarters of global GDP. Even a modest gain in checkout completion sits on top of a very large river of revenue, which is why the B2C experiment targets checkout before anything upstream.
The industrial row runs on the longest clock. Awareness work aimed at a named account list pays off in opportunities created months later, so its metric counts target-account opportunities rather than this quarter's clicks.
Choose the row from your own data
Pick the model that matches how customers buy, then verify it against your own numbers. A competitor's funnel description is a hypothesis about their business, not a finding about yours. Check where deals stall in the CRM, where carts die in analytics and where trials go cold in the product logs. Whichever stage shows the largest reliable drop is the row you are in.
How to Measure Impact Without Fooling Yourself
A dashboard says paid search earned most of the credit for last quarter's conversions. That single line is the most expensive sentence in growth marketing, because it invites a budget decision the report can't support.
Attribution answers which touchpoints get credit inside the journey. Incrementality answers a harder question. What would not have happened without the activity? A channel can collect generous credit because high-intent buyers touched it on their way to a purchase they were always going to make. Google's Analytics documentation describes data-driven attribution as a machine-learning approach that weighs converting and non-converting paths, looking at time to conversion, device type, and the number and sequence of ad interactions. It estimates relative contribution through a counterfactual comparison rather than handing everything to the first or last click. That's useful for reallocating budget across full-funnel channels. It is not proof of incremental lift.
Fix the settings before you compare anything
Google's GA4 attribution documentation lists three models in the Attribution reports: data-driven attribution, paid and organic last click, and Google paid channels last click. It also asks you to choose which channels are eligible for credit. Document one model, one eligible-channel setting and one primary conversion event before comparing anything. Change that setting and the screen shows a performance shift that never touched a real customer.
The same source notes that direct visits generally receive no credit unless the entire key-event path consists of direct visits. That detail explains a lot of "brand is underperforming" panic.
| Method | Question it answers | Best used for | Main limitation |
|---|---|---|---|
| **Data-driven attribution in GA4** | Which touchpoints earned modeled credit | Spotting journey patterns and moving budget between channels | Shows credit, not proof of extra sales |
| **Geo-split test** | How many extra conversions came from exposed regions | Measuring real lift from paid media | Needs enough regions and conversion volume |
| **Audience holdout** | How converting people differ with and without exposure | Retargeting and paid social | Needs a clean control group |
| **Lagged CRM pipeline review** | Which accounts reached pipeline or revenue after exposure | Long B2B cycles and brand work | Slow and needs consistent CRM tagging |
Reconcile the platforms against your CRM
Modeled credit drifts away from money in a predictable way. Platform-reported conversions count clicks and views; the CRM counts closed revenue, refunds and sales cycles that ran past the reporting window. Reconcile the two monthly, by channel and by campaign, and treat the gap as a finding rather than an error.
Then run the causal version: geo-splits, audience holdouts, or randomized conversion-lift tests, compared against modeled attribution by channel. A large discrepancy usually means selection bias, channel overlap, missing offline conversions, or unstable identity resolution, and each one has a different fix.
The hardest measurement problem sits outside every attribution model. Buyers in long cycles read ungated guides, peer reviews and community threads for weeks before a form appears, so the recorded touchpoint is often the last one, not the persuasive one. A 2025 survey of more than 600 B2B marketers found attribution use widespread, at 92% of ABM teams and 68% of legacy teams, while the measurement foundation underneath stayed weak, as the 2025 state of B2B marketing metrics survey sets out. Judge brand, education and community work through account-level cohorts and lagged pipeline results instead.
Decision rule: attribution diagnoses journeys and sequences creative. Experiments decide where the budget goes.
For a worked walkthrough of tying channels together without double counting, cross-channel marketing attribution explained covers the reporting setup.
How to Prioritize Growth Experiments That Pay Off
Ten tests launch on a Monday. By Friday nobody can say which one moved anything, and the team has learned that testing is exhausting rather than useful. The fix is arithmetic, not ambition.
Score every idea before you build it. The sequence below takes an hour and saves a quarter.
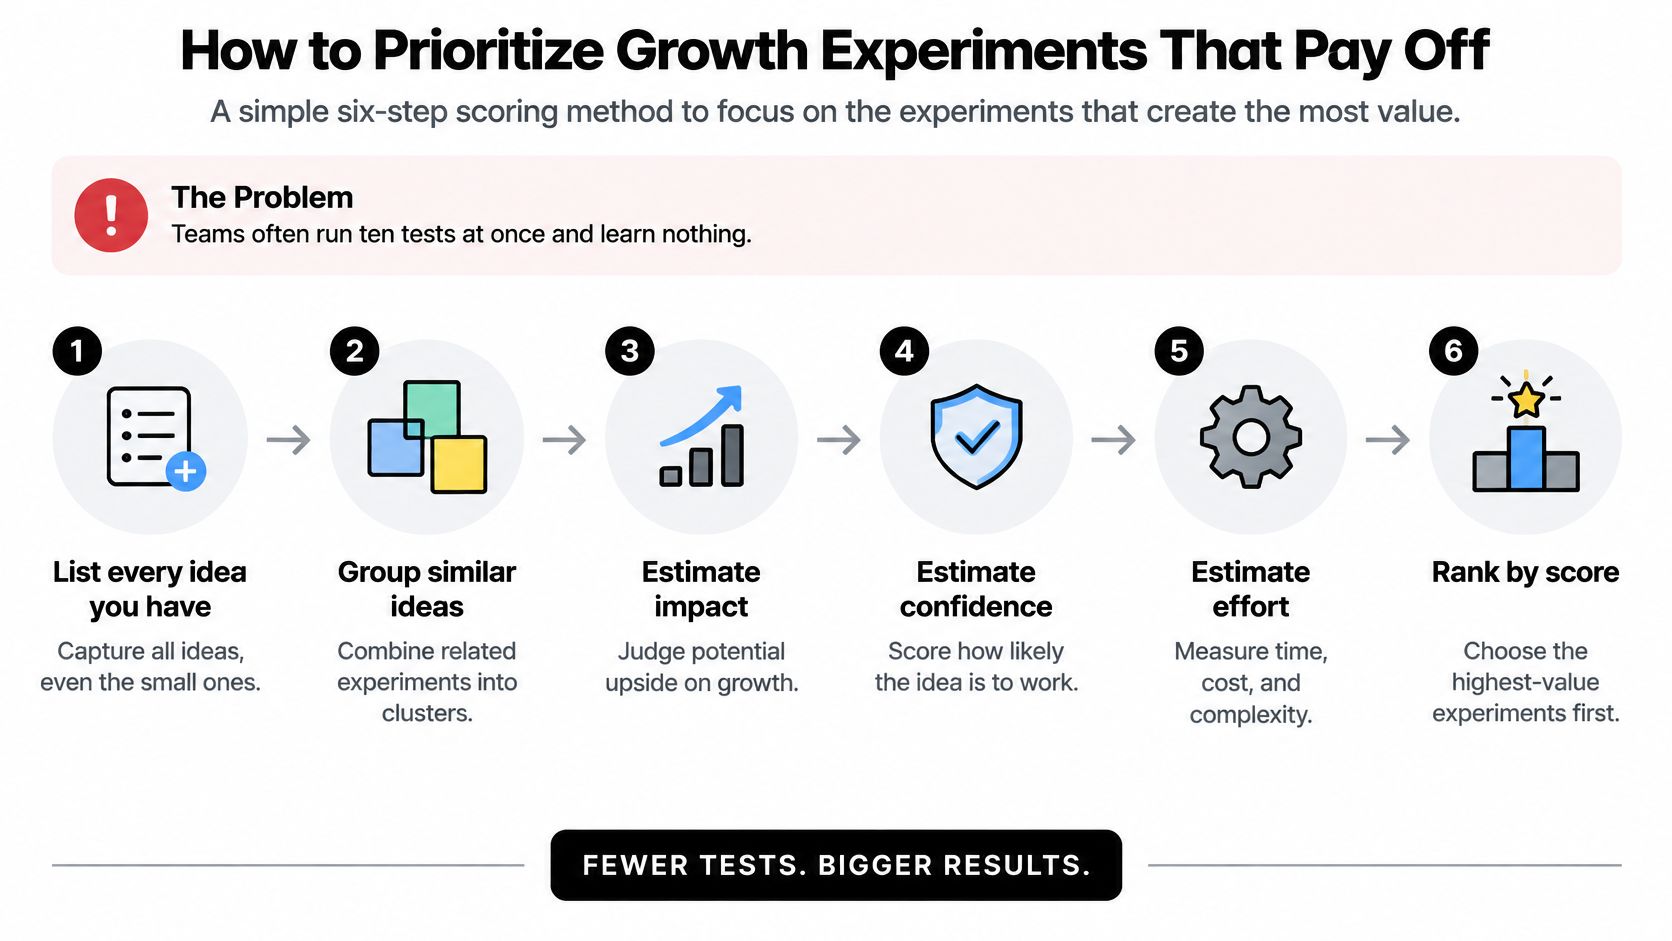
1. List every idea you have, including the ones that feel small. A one-line change to checkout copy competes with a six-week site rebuild, and it sometimes wins. Ideas buried because they seem trivial are the cheapest wins available.
2. Score each idea from 1 to 10 on three dimensions. Expected impact. Confidence in the evidence behind it (a support-ticket pattern beats a hunch). Ease of delivery, where 10 means shippable this week.
3. Multiply the three scores. An idea at 8 for impact, 7 for confidence and 9 for ease scores 504. Ranking by the product forces the team to argue about evidence and effort instead of who spoke last in the meeting.
4. Find the bottleneck with step-level completion rates. Baymard's checkout usability research reports a global average cart-abandonment rate of 70.19%, and estimates the average large ecommerce site could gain a 35.26% conversion-rate increase from solvable checkout design fixes. One broken step usually outranks a new campaign.
5. Keep the top three and ignore the rest for now. Concentration beats coverage. Sprints & Sneakers builds this into its own process at step two, determining where the client wants to grow and focusing on the keywords and pages with the biggest impact on traffic and revenue rather than tackling everything at once.
6. Give each test one success metric and one review date. Stop anything that misses both. A test without a stop rule becomes a permanent feature nobody defends.
Write the hypothesis before the build
Each experiment names a clear bet, in plain words: if guest checkout appears first, more shoppers finish their order. Then, before reading a single result, set a minimum sample size or run length and write down what a failure looks like.
Stopping early on a good-looking day is the most common way teams fool themselves. Day two winners are usually noise wearing a costume.
The video below breaks down how a prioritised test gets run and reviewed.
<iframe width="100%" style="aspect-ratio: 16 / 9;" src="https://www.youtube.com/embed/gP3BTfAiHrg" frameborder="0" allow="autoplay; encrypted-media" allowfullscreen></iframe>More ready-to-run test designs sit in this collection of marketing experiment examples.
AI Tactics That Work and the Points Where to Stop Automating
AI speeds up growth work. That's settled. The open question is whether customers still trust what they're looking at once the speed arrives, and that question lives inside the funnel itself. Faster creative that erodes trust shows up weeks later as churn, where no ad report will flag it.
Four tactics pay off reliably. Testing many ad creative variants in short cycles, because volume plus a clear success metric beats one polished concept. Scoring inbound leads by fit and engagement, so sales spends its first hour on the right accounts. Personalizing lifecycle emails from real purchase history instead of first-name tokens. Automating weekly reporting so the analyst's morning goes to decisions rather than screenshots. Sprints & Sneakers runs experiment work on hybrid teams: growth marketers paired with AI agents for research, reporting and execution, with the hypothesis staying in human hands.
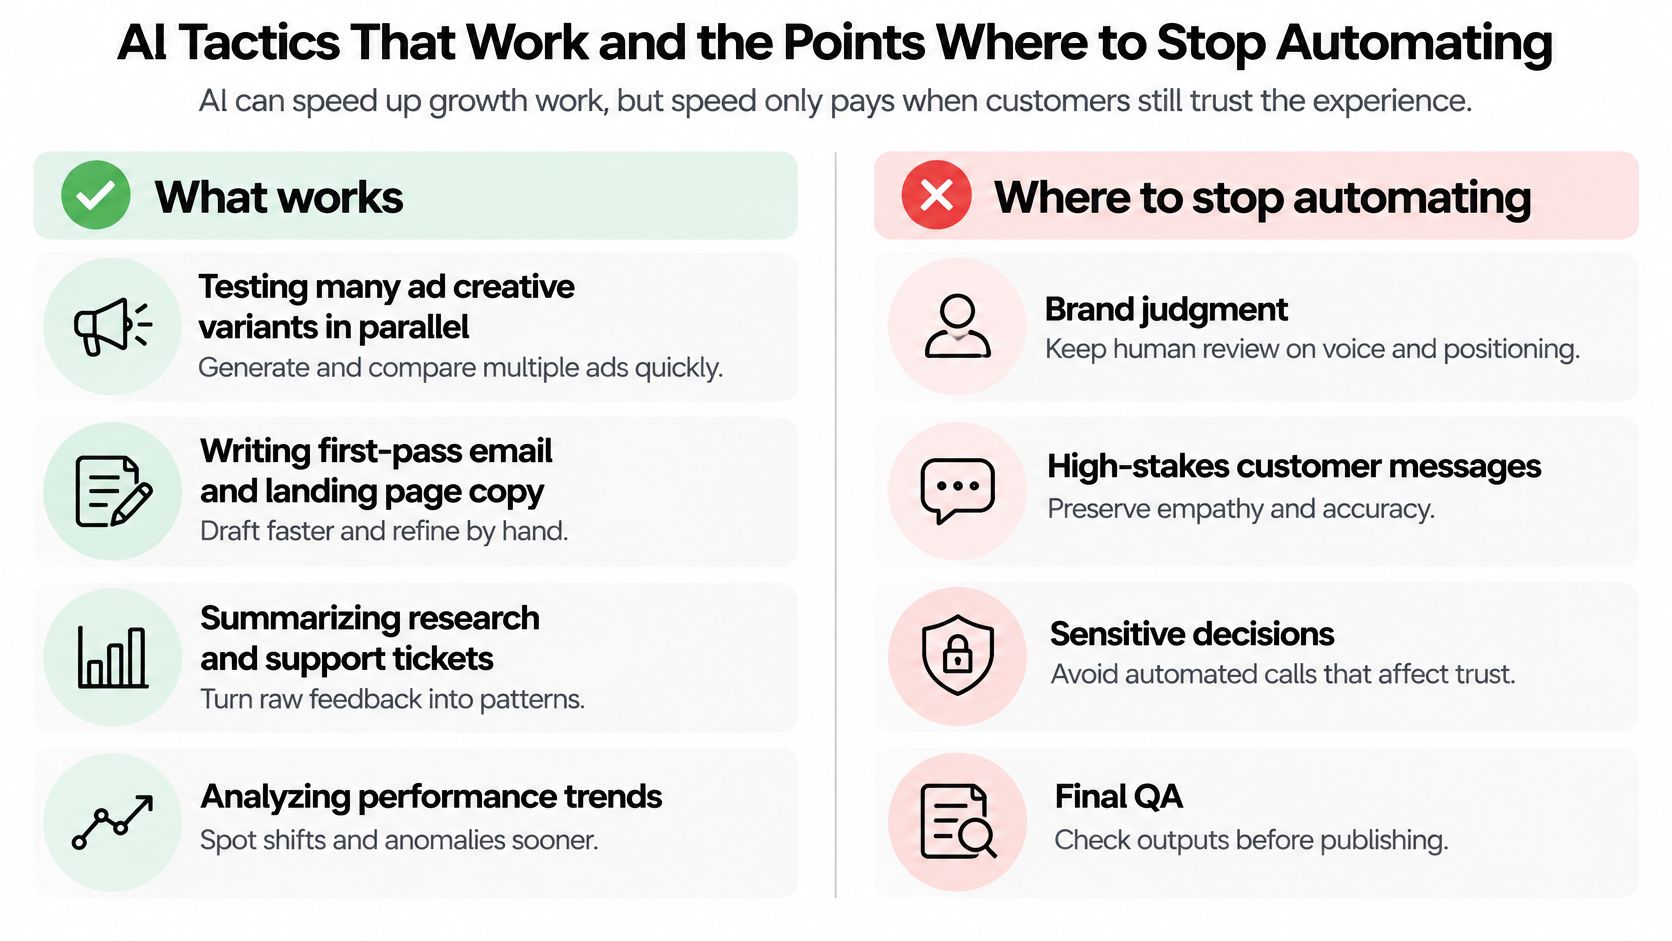
Three places automation should stop
Personal data without clear disclosure. If a customer can't tell why the message knows what it knows, the personalization is a liability with good grammar.
Personalization that reads as surveillance. Retargeting a product a shopper already bought, or referencing a page they visited in a sensitive category, converts once and costs the relationship.
Any automated step with no human escalation path. A chatbot that can't hand over, or a scoring model that disqualifies inbound leads without oversight, will eventually make a decision nobody audited.
The trust numbers make this concrete. Adobe's Digital Trends consumer research surveyed 4,000 customers alongside 3,000 executives and practitioners specifically to examine how people respond to AI-enabled experiences, which shows adoption and acceptance are two different projects. The two can even pull against each other: efficiency climbs while perceived privacy risk climbs with it, and the customer feels the second effect long before a dashboard shows the first.
Privacy-first design isn't compliance paperwork. It behaves like a retention and brand variable, especially once customers can't tell personalization apart from surveillance.
Benchmarks size the bet. They can't predict the outcome. McKinsey's analysis of AI-powered marketing and sales reports revenue uplift of 3% to 15% and sales return-on-investment uplift of 10% to 20% for companies investing in AI across marketing and sales. Treat those ranges as measurement design targets: pick one high-volume workflow, baseline it, then track revenue and sales ROI separately after deployment.
The test to run compares the AI version against the human-assisted version on opt-in rate, complaint rate, repeat purchase, churn and lifetime value. Attribution works here as a diagnostic: it tells you which step the AI version improved and which one it damaged. Click-through rate alone will endorse an experience that erodes retention. Teams mapping this out get a fuller picture from the benefits of AI in marketing.
Three Growth Cases You Can Copy Next Week
Three leaks, one tested change each, one number to watch. These patterns repeat across funnels of every shape, so treat each as a hypothesis to run against your own data, in the same order the funnel runs.
The shop that hides shipping costs until the last step
Shoppers add to cart, see the shipping charge on the payment screen, and leave. Every paid click still costs the same. The tested change is small: show the shipping cost on the product page and run it against the current checkout, watching completion at each checkout step, since the order count arrives too late to show where buyers left.
Before blaming the copy, rule out a slow page. Google's Core Web Vitals thresholds put a good loading experience at LCP of 2.5 seconds or less, INP under 200 milliseconds and CLS of 0.1 or lower, measured in field data from real users. Pull that data for your highest-traffic landing pages and repair anything outside those lines first.
The takeaway: one dimension of friction, tested in isolation, measured at the step where it lives.
The lead form that asks for a sales call's worth of answers
Start with the number to watch: the qualified-lead rate, meaning the share of submissions sales accepts. A demo request that demands company size, budget, timeline and a phone number filters out buyers who are early on purpose. They wanted a conversation, and the form asks for a commitment first.
The tested change: cut the form to name, work email and one question about the problem, and let the call handle the rest. Score both versions on qualified leads per hundred visits, so a lighter form cannot win by generating noise.
The takeaway: less friction at one step only pays if the next step still produces quality.
The manufacturer whose buyers read for months
Last-click leads are the wrong scoreboard here. The guides that educate industrial buyers look worthless because sales hears the name only when the form lands, months after the first visit. The tested change is in measurement, not media: track account-level cohorts for a named target list and read pipeline and revenue with a lag.
The takeaway: let the measurement window match the buying cycle. A weekly report will keep calling early touches worthless.
The pattern matters more than the industry. Find the leak, change one thing, measure the step, and treat attribution as a diagnostic that shows where to look while the cohort data settles. Further worked examples of that loop sit in these growth marketing case studies.
Run Your First Growth Experiment This Week
A first experiment does not need a quarter. It needs one week, one leak and a decision rule agreed before the result arrives.
- Write the six stage names and one metric for each, starting from the table earlier in this guide. Put them in one document so everyone argues about the same numbers.
- Pull step-level completion for your funnel and circle the largest reliable drop, even if a smaller number looks louder.
- Write one experiment as a hypothesis: if we change X, Y rises, because Z. Add the success metric and the review date on the same line.
- Document one attribution model, one eligible-channel setting and one primary conversion event before comparing any two campaigns. Treat attribution as a diagnostic for where demand may be forming, including before a prospect is identifiable, rather than proof of impact.
- Export field data for your three highest-traffic landing pages and check LCP, INP and CLS against the thresholds.
- Write down where AI touches customer data, how customers are told, and who takes over when the automation fails.
- Put the review on the calendar and write the result that will end the test before the test begins.
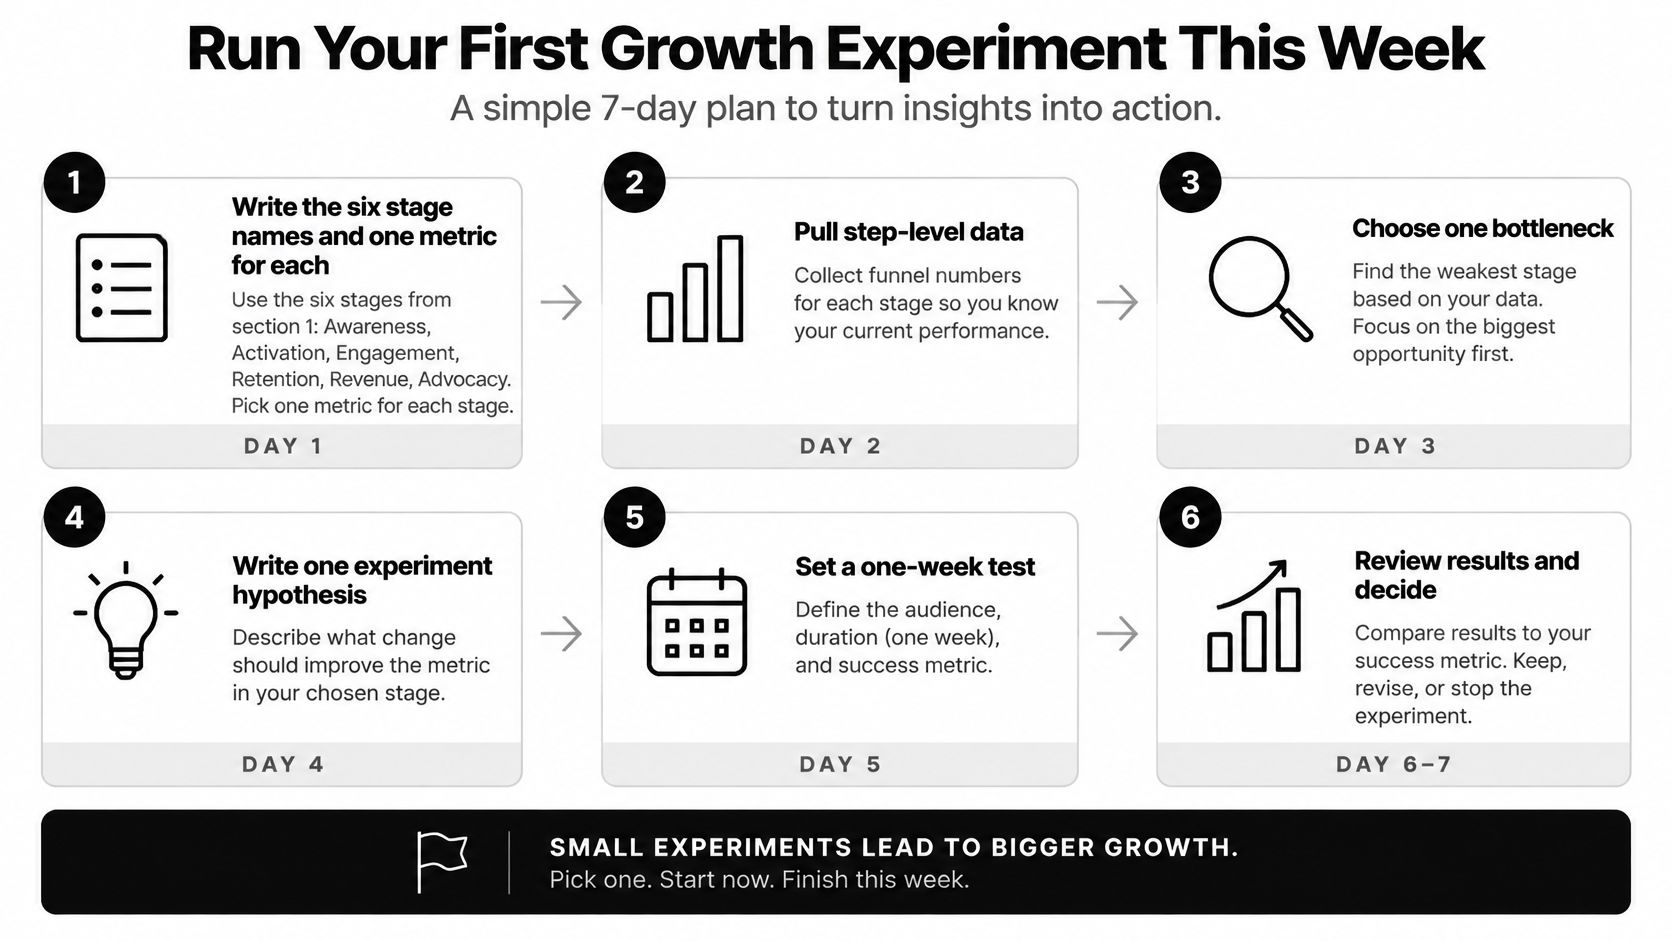
That is a full first cycle: one stage, one change, one measured step, one decision. The second cycle should start cleaner because the question is narrower and the stopping rule is already written.
If the largest drop is still a guess, Sprints & Sneakers starts with a personalized growth scan that names the biggest opportunities and the single bottleneck, then runs monthly sprints with senior strategists and AI agents. Start the conversation at Sprints & Sneakers.
Related articles
Frequently asked questions
Growth marketing, AI and automation, SEO, performance marketing, retention strategies, and sustainable business practices.
Weekly. Subscribe to our newsletter to get new articles straight to your inbox.
Absolutely. Everything we publish is designed to be actionable. Take it, test it, and make it your own.
Yes. We publish experiments with real numbers. What worked, what didn't, and what we learned.
Our growth team — strategists, performance marketers, data specialists, and AI builders who work on client campaigns every day.
We're open to it. Reach out via our contact page with your topic and we'll take a look.