
8 Funnel Analytics Tools Compared for 2026: B2B and B2C
Compare 8 funnel analytics tools for 2026, from Google Analytics 4 to Adobe Analytics. See pricing, best use cases, and B2B vs B2C fit.
A signup page converts at 4%, so the team rewrites its ads. Then mobile visitors reach a broken thank-you page, the CRM fails to store their leads, and Monday's report still blames the creative. Funnel analytics tools help trace the drop-off beyond the form and show whether it affects revenue.
This list covers eight tools, from free web analytics to enterprise digital experience platforms. Each answers a different question: where users leave, why they leave, or whether the drop-off costs revenue.
Practical rule: If the report blames the ad before anyone checks what happens after form submission, the funnel diagnosis is incomplete.
B2B funnels often involve long trials, multiple buyers, and CRM handoffs that can split one account into several records. B2C funnels tend to move faster, rely heavily on mobile, and depend on repeat purchases. European teams must also account for consent: when visitors decline cookies, some sessions go unrecorded, so analytics reports show only part of the journey.
For a club working on turning enquiries into golf club members, the next step might be whether an enquiry becomes a visit or membership. A prospect may compare membership options, return to the enquiry page, then submit later. A June 2009 McKinsey study of about 20,000 consumers described consideration, evaluation, purchase, and post-purchase as a cycle. Measure where prospects leave, then check whether that loss affects revenue.
Table of Contents
- 1. Google Analytics 4 (Funnel Exploration)
- 2. Mixpanel
- 3. Amplitude
- 4. Heap
- 5. Hotjar
- 6. FullStory
- 7. Contentsquare
- 8. Adobe Analytics
- Funnel Analytics Tools at a Glance
- Pick One Tool and Fix One Drop-Off This Week
1. Google Analytics 4 (Funnel Exploration)
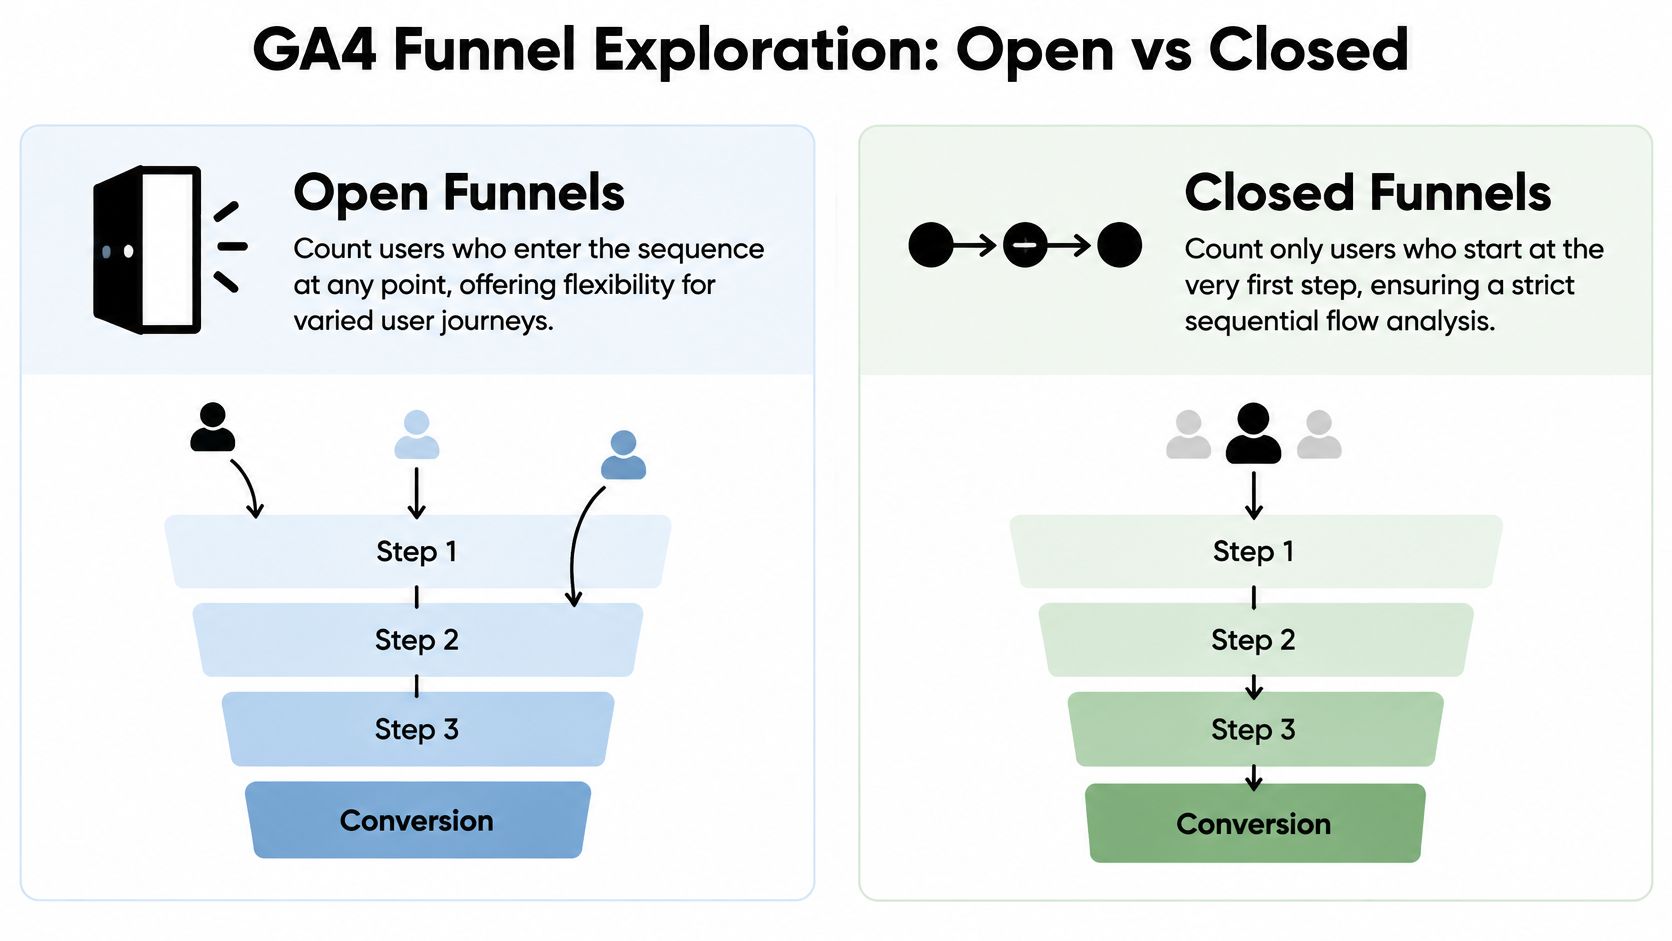
Google Analytics 4 answers where users leave. It replaced Universal Analytics in 2023. Funnel Exploration follows events such as page view, add to cart, checkout, and purchase, then counts who finishes each step. Open funnels include people who enter mid-path. Closed funnels count only people who start at step one. The standard version is free, which fits teams already on Google Ads.
A clothing store and a lead form
Say an online clothing store builds product view to purchase, then splits mobile and desktop. Mobile users fall off hardest when the shipping fee appears, so the cost showed up too late. A B2B lead site runs landing page, form submit, thank-you page. Paid social visitors submit at half the rate of search visitors. That is a source problem, not a headline problem.
- Name the events first: Clear names such as
form_submitkeep the report readable later. - Break down by device: Mobile drop-off is the usual hidden miss in GA4 funnels.
- Match the window: A 7-day conversion window fits high-consideration buys better than a short default.
GA4 samples some reports and gives thin session context, so pair it with replay when the number isn't enough. Check consent mode first. Under GDPR and Dutch rules, declined cookies leave a hole. A wider shortlist sits in these marketing analytics tools.
2. Mixpanel

A project-tool funnel can show whether inviting a colleague within three days is linked to becoming a customer. Track sign-up, first project, and invite sent, then compare conversion for people who invite someone with those who do not. If the gap is clear, test moving the invite prompt earlier. The funnel shows where users leave; the revenue impact still needs checking against customer outcomes.
Mixpanel tracks actions as events with properties, then reports conversion between steps within a chosen time window. Segment results by plan, channel, or company size to see which groups progress. This suits product teams tracking activation and retention alongside acquisition, including B2B products with longer trials and CRM handoffs. A free tier has a monthly event cap, while paid tiers support larger volumes.
Define event names before tracking begins. Otherwise, the funnel becomes a junk drawer.
Use a consistent format, such as Project Created, and keep the funnel to four to six steps so the result stays actionable. A short window can suit a fast consumer-app decision; B2B trials may need a longer window to capture delayed conversions. Compare periods of equal length to avoid confusing seasonality with a change in performance.
Mixpanel shows where users drop off and how behavior differs by segment. It does not explain why they leave, and an event-level conversion gap does not prove that the drop-off costs revenue. Pair funnel results with customer and revenue data before changing spend or product flows. A marketing analytics dashboard can bring those performance signals together, provided event names stay consistent.
3. Amplitude
A meal-kit checkout has a leak, but the path to it is unclear. Customers who abandon often opened the FAQ first. Amplitude's Pathfinder can show that detour, while Funnel Analysis reports conversion between defined steps and time to convert. The team can move delivery details higher on the page, then track whether abandonment changes.
For a fintech account-opening funnel, compare people who start on mobile with those who start on desktop. If the two groups take different paths before making a first deposit, the team can test a continue-on-desktop prompt. That helps identify whether the drop-off reflects a fixable handoff or a deeper obstacle.
Amplitude also includes experimentation and session replay. Use those to investigate a specific leak, rather than starting with every possible path. A finished-funnel cohort can be compared with people who left, using their first-week actions to look for patterns. Then test a change in Amplitude or export the cohort to an existing testing tool.
The trade-off is setup and data governance. Check which events and properties the team needs before choosing a plan, and ask legal which data-residency option fits Dutch or EU customer data. For a structured way to examine each stage, see this guide to conversion funnel analysis.
4. Heap
A B2B pricing page has been leaking trials for three weeks. Nobody tagged the compare-plans click, and engineering has no slot for a new event. Heap already recorded that click. Autocapture stores most interactions once the snippet is live, so the step can be defined on past data. Reports still show conversion between steps, and you can filter people by what they did before the leak and after it.
Heap is strongest on where users leave when the step was never planned. For a long B2B trial with several buyers, define the missing step and see which action reaches the CRM handoff. A B2C course site is quicker. Preview to enrollment often dies at payment-method selection. Change those options and watch the next cohort. People who compare plans convert better than people who skip the page, so that control stays.
I would not leave autocapture unnamed. Unlabeled events make every funnel hard to read. Block form fields with personal data before collection starts. Test the idea on history, then track the winning step if it keeps showing up.
Volume is the trade-off. Teams short on engineering time get speed. Speed without consent rules is a liability. The cookie banner has to match what autocapture stores. Dutch and EU rules still apply when the tool is convenient. If measurement is still undefined, start with what marketing analytics covers before adding another collector.
5. Hotjar
A B2B trial funnel runs from homepage to pricing to sign-up. Hotjar recordings can show visitors scrolling past the form because a vague banner pushes it below the fold. The team can then test a clearer banner or a more visible form. Funnels show where visitors leave; heatmaps, recordings, and on-site surveys help explain what they encountered.
Hotjar suits teams investigating page-level friction, especially on marketing and landing pages. It gives a qualitative view, not a complete account of a B2B buying journey with multiple decision-makers and a CRM handoff. For B2C, a short poll on the shipping step might reveal that visitors need clearer delivery details before they buy.

Ten recordings, one question
Start with recordings from the page where the funnel drops. Look for repeated behavior, then check the heatmap on the next step: visitors may leave because the next action is hard to find. A one-question survey can test that explanation. Use customer behavior analysis to put those observations alongside the funnel counts, rather than treating a poll as proof.
Set up consent and recording controls before collecting sessions. European privacy rules still apply to behavior tools, and a cookie banner should accurately explain what the site records. Hotjar can show where visitors hesitate; it cannot establish whether that drop-off costs revenue without conversion and sales data.
6. FullStory
A software sign-up form loses users at the final step. FullStory session replays can show repeated clicks on a disabled button, pointing to a validation problem rather than a confusing page. The tool connects replay sessions with funnels and conversion events, so teams can inspect the experience behind a drop-off. Rage clicks, dead clicks, and error clicks help narrow the search. Its paid plans suit teams with budget for product analytics, rather than a quick side test.
A short walk-through of how replay ties to a broken step:
<iframe width="100%" style="aspect-ratio: 16 / 9;" src="https://www.youtube.com/embed/Q18TO1lZVz8" frameborder="0" allow="autoplay; encrypted-media" allowfullscreen></iframe>For a furniture retailer, checkout replays might show shoppers trying to zoom a size chart on mobile. If the image does not load properly, fixing it addresses the observed friction. Replay can show what happened; pair it with funnel data to assess whether the issue affects revenue.
Start with the largest drop-off, then filter for rage clicks on that page. Mask form fields and personal details before recording begins. Review sessions that show the same issue and write down the pattern before proposing a redesign. Assign someone to review flagged sessions regularly, or the replay library can grow without producing a fix.
7. Contentsquare
A travel site finds that mobile visitors rarely use its search filter. Moving the filter higher could help more of them progress from search to booking. Contentsquare maps how visitors move across a large site, using zone-based analysis to show how people interact with page elements and Journey Analysis to trace entry points, routes, and exits. Large retail, travel, and finance brands can use it to compare journeys across markets. Enterprise pricing and a longer setup make it a poor fit if teams still define purchases differently.
A retail group could compare checkout across five countries and find that one market loses shoppers at the delivery-date step because a local payment option is missing.
Cloud deployment is common in this category. Mordor Intelligence's analysis of the North American customer journey analytics market reports that cloud deployments represented 65.29% of the market in 2025 and were its fastest-growing mode. For European teams, the practical challenge is connecting anonymous visits, known contacts, and buying groups without counting them as separate account funnels. Check latency, identity accuracy, backfills, schema changes, and deletion across downstream systems.
Start with zone analysis on high-traffic pages before a redesign. Compare the same funnel by market and device, keep the tracked list short, and agree on one conversion definition before the first review.
8. Adobe Analytics
A corporate bank may need to connect an online loan application to a later branch visit or call-center sale. Adobe Analytics can bring web, app, advertising, CRM, and offline data into one analysis. In Analysis Workspace, Fallout shows exits across a defined sequence of steps. Custom attribution, segments, and cross-channel stitching support large organizations, but setup requires skilled analysts and formal implementation.
Suppose applicants who call convert more often than those who complete the form alone. The bank could test offering a callback during the application. A B2B manufacturer could also trace trade-show leads through its website and into CRM opportunities, then compare which event types progress to a demo.
Even connected reporting has limits when the inputs are incomplete or inconsistent. TransUnion research on marketers' measurement challenges found that 49% cited siloed or incomplete data as a barrier to accurate measurement, 48% cited cross-channel deduplication, and 41% cited walled-garden limits. The practical test is whether the added revenue insight justifies the implementation and analyst time.
Define conversions consistently in CRM and analytics before building a Fallout report. Segment the sequence by channel, and review offline data joins with legal and IT under Dutch and EU privacy rules. Standard funnel definitions help departments report the same outcomes.
Funnel Analytics Tools at a Glance
Match the tool to one question: where users leave, why they leave, or whether that exit costs revenue. A B2B funnel (long trial, several buyers, a CRM handoff) and a B2C funnel (mobile traffic, a fast decision, a repeat purchase) do not share the same chart. On European sites, declined consent thins every row below.
| Tool | Free plan | Best question | Funnel fit | Consent limit |
|---|---|---|---|---|
| Google Analytics 4 (Funnel Exploration) | Yes, standard property | Where users leave | B2C ecommerce and content; thin on multi-buyer B2B | Denied consent models or drops hits; replay needs another tool |
| Mixpanel | Yes, monthly event cap | Whether the drop-off hits activation or revenue | B2B product-led trials and B2C app events | Events stop or shrink without a consented tag |
| Amplitude | Yes, monthly event allowance | Where paths split before revenue | B2B and B2C product funnels, through enterprise | Same consent gate on event volume |
| Heap | Yes, free tier with usage limits | Where they left, rebuilt after the fact | Teams that cannot wait on engineering | Autocapture still needs consent |
| Hotjar | Yes, limited sessions | Why they left on the page | B2C sites; lighter B2B | Recordings and surveys need explicit consent |
| FullStory | No, paid plans only | Why friction shows at one step | Product and UX, B2B or B2C | Session replay stays off without consent |
| Contentsquare | No public free plan | Where and why, tied to revenue zones | Large B2C retail, travel, and finance | Enterprise consent and processing terms |
| Adobe Analytics | No public free plan | Whether the exit reaches CRM or offline revenue | Large B2B and multi-channel B2C | Identity joins need legal review |
Free tiers answer "where" until the cap hides the tail of the funnel. Paid suites answer "did it cost revenue" only when the revenue definition already matches the step. I would not pay for a second collector until that question is named.
Pick One Tool and Fix One Drop-Off This Week
A mobile checkout that dies on the payment step and a trial that never reaches a second user are different jobs. Match the tool to the question it answers best: where people leave, why they leave, or whether that step costs revenue.
A single landing page can live in free web analytics. SaaS activation wants event-level product analytics and a conversion window that matches the trial. A bounce you cannot explain wants session replay, heatmaps, or both. Enterprise teams tying web steps to pipeline can justify a heavier platform once the stage names already agree.
Start with one funnel, one drop-off step, and 10 recordings from that step. Name the events before the build. Split mobile from desktop on the first pass. Set the window to the actual cycle, not the default. If consent strips part of the traffic, say so in the readout. A complete-looking chart built on declined cookies is a partial chart.
Skip a second collector when the first chart feels thin. Check identity, deduplication, and whether platform-reported lift beats incremental lift. When CRM revenue, ad platforms, and the analytics tool disagree, the definitions are out of line, so settle those before anyone rewrites the creative. Adding AI on top of that mess speeds up a confident wrong answer. A governed metric layer, documented events, and a human check before budget moves are the minimum.
Score the two funnels on different clocks. A B2B rate that only counts a short default window will miss deals that close on the length of the trial, after several buyers and a CRM handoff. A B2C rate should show same-session checkout completion and whether that buyer purchases again. Blend those into one average and both leaks vanish.
Fortune Business Insights values the global customer journey analytics market at about USD 4.96 billion in 2025 and projects USD 11.58 billion by 2034, a 9.84% compound annual growth rate, while noting that published estimates vary by method.
That spend does not repair a missing thank-you page. Infrastructure helps after the stage names are stable.
Sprints & Sneakers, a B Corp-certified growth marketing agency based in Amsterdam and Groningen, offers a free growth audit. That first step maps the full funnel across acquisition, conversion, and retention, runs a tracking and attribution check on what is measured and what is missed, and builds a roadmap for the first sprint. Growth is run as separate B2B and B2C funnels, because a different business needs a different funnel. Visit Sprints & Sneakers to book that audit and pick the one drop-off to fix this week.
Related articles

Frequently asked questions
Growth marketing, AI and automation, SEO, performance marketing, retention strategies, and sustainable business practices.
Weekly. Subscribe to our newsletter to get new articles straight to your inbox.
Absolutely. Everything we publish is designed to be actionable. Take it, test it, and make it your own.
Yes. We publish experiments with real numbers. What worked, what didn't, and what we learned.
Our growth team — strategists, performance marketers, data specialists, and AI builders who work on client campaigns every day.
We're open to it. Reach out via our contact page with your topic and we'll take a look.