
Is E Commerce Still Profitable? a 2026 Margin Guide
Is e commerce still profitable in 2026? See the margin math, return costs and ad break-even numbers, plus a checklist to test your own store.
Yes, e-commerce is still profitable, but only for stores whose contribution margin after returns, fees and ad spend stays positive. A store can post record sales every month and still lose cash on every order, because revenue says nothing about what's left once the product, the parcel, the return label and the click are all paid for.
That's the counterintuitive part worth sitting with. Growth feels like proof, yet growth on negative unit economics just loses money faster. The question isn't whether people still buy online. It's whether a specific store keeps money after the full cost of a sale, and that's a question any operator can answer with last month's orders and an afternoon of honest subtraction.
Table of Contents
- Yes, E-commerce Is Still Profitable If the Math Works
- The Five Numbers That Decide Whether You Profit
- How to Calculate Profit After Returns and Fees
- Which Business Models Still Make Money
- Which Niches Keep Margin After Returns
- Where Acquisition and Checkout Costs Leak Profit
- Levers That Lift Margin Without More Ad Spend
- Run Your Profitability Check This Week
Yes, E-commerce Is Still Profitable If the Math Works
E-commerce still has room to grow, but market demand is only the starting point. The UN Trade and Development global e-commerce database covers 69 economies representing approximately 60% of global GDP and 74% of worldwide exports of goods and services. UNCTAD also reported that ICT-goods exports increased 10% in 2024 to almost $3 trillion. Digital trade is broad and structural, and it has outlasted the pandemic.
That growth does not guarantee that an individual store is profitable. A market can expand while a shop pays too much for clicks, underestimates shipping costs or absorbs returns it never priced in. Market growth shows that buyers exist; order-level costs determine whether a store keeps any of the revenue.
The rule: Profitability at the current scale depends on positive contribution after returns and ad spend that clears break-even. If either condition fails, market growth will not fix the economics.
Profitability signals at a glance
| Signal | Reported figure | What it means for your margin |
|---|---|---|
| Global reach | 69 economies covering about 60% of global GDP and 74% of goods and services exports (UNCTAD) | Online demand spans multiple markets, but each store still has to make its own orders profitable |
| Large-platform scale | Amazon fiscal 2025: about $716.9 billion in net sales and $80.0 billion in operating income; AWS accounted for about 57% of operating income | A large business can generate operating income, but sales volume alone does not show what a smaller store earns per order |
| ICT-goods exports, 2024 | Up 10% to almost $3 trillion (UNCTAD) | Growth in digital trade supports the case for online commerce, not any one store's margins |
For an individual store, the practical checks are contribution margin, customer payback and ad break-even. Treat broad market figures as context, not as evidence that a specific product, channel or campaign will be profitable.
Same-day test: Take last month's net revenue and subtract the variable costs attached to each order, including product cost, payment fees, shipping, returns and support. Then check whether the remaining contribution covers acquisition spend. If it does not, buying more traffic can increase sales while worsening the store's economics.
The Five Numbers That Decide Whether You Profit
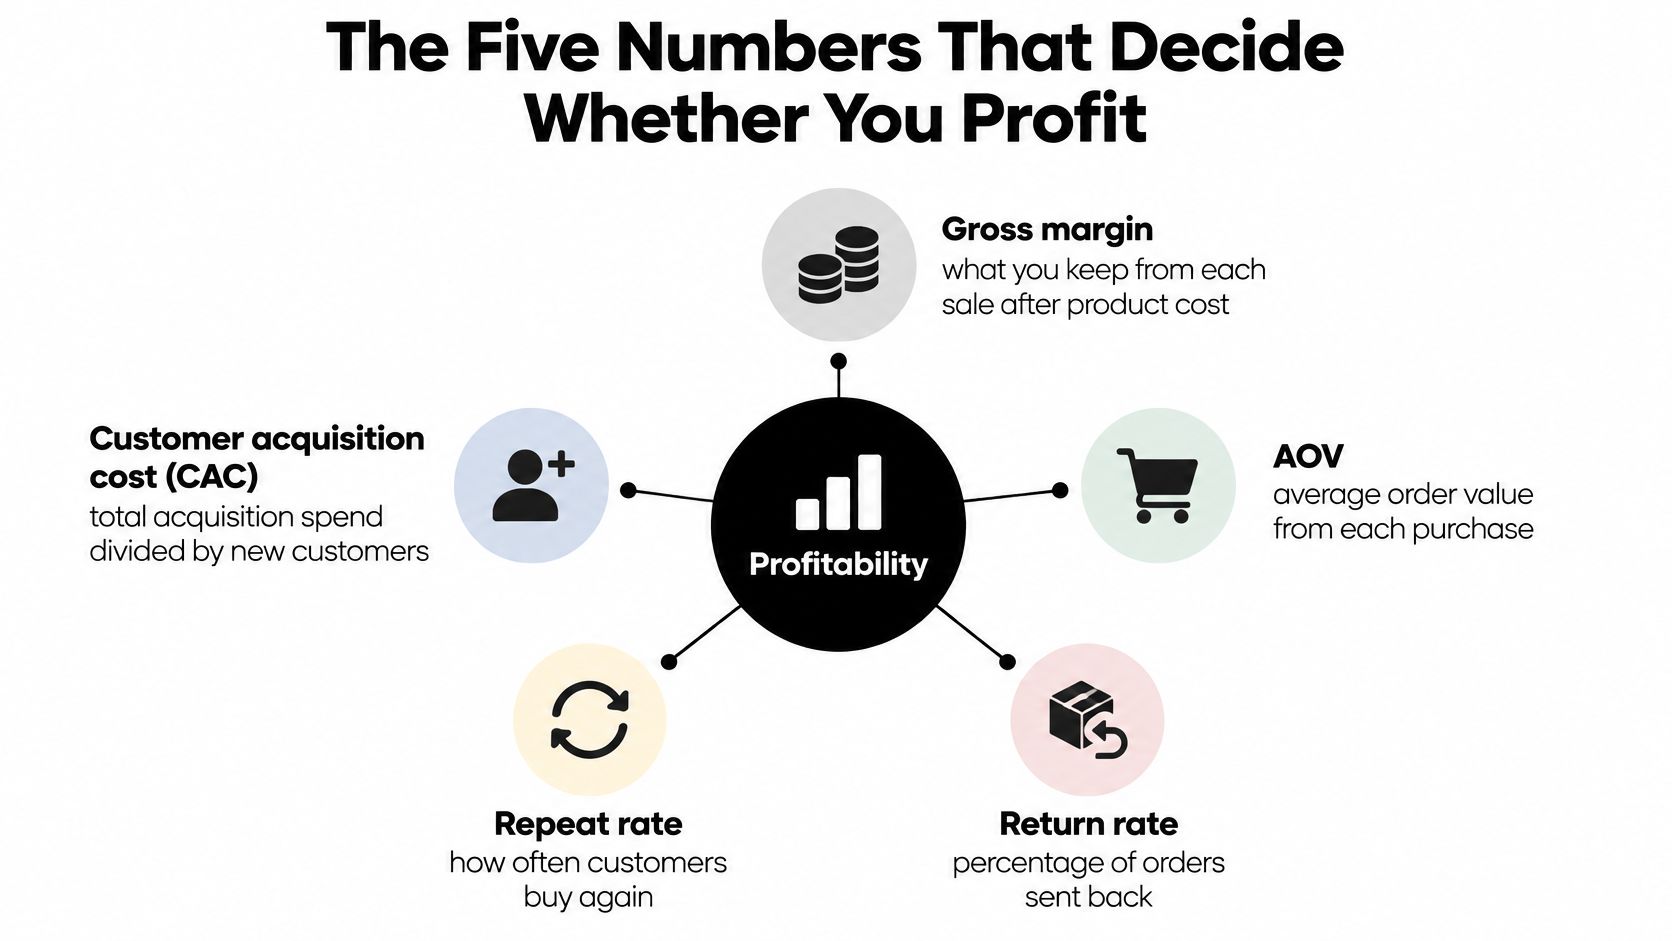
An order can look profitable on gross margin and still lose money after acquisition, fees and returns. Start by defining the numbers consistently. Gross margin is revenue minus product cost, divided by revenue. Customer acquisition cost (CAC) is total acquisition spend divided by new customers. Lifetime value (LTV) is the gross profit a customer generates across the full relationship.
Contribution margin is what remains after product cost, payment fees, shipping, returns and support. ROAS break-even is the return on ad spend required to cover costs. For a product with weak unit economics, more traffic can increase the loss. Product selection matters, so choose a profitable product to sell before increasing spend.
Profit metrics, formulas and benchmarks
| Metric | How to calculate | Healthy benchmark |
|---|---|---|
| Gross margin | (Revenue minus product cost) divided by revenue | Set by category; compare with your own last 12 months |
| Customer acquisition cost (CAC) | Total acquisition spend divided by new customers | We use LTV at roughly three times CAC as a starting filter |
| Customer lifetime value (LTV) | Gross profit per customer across their full relationship | Compare against CAC by first-purchase cohort |
| Contribution margin | Revenue minus product, payment, shipping, returns and support costs | Positive after returns; this is the profit number |
| ROAS break-even | 1 divided by contribution margin before ads | Often 2.5x to 3x for many businesses, according to the [2025 benchmark summarized by Zembula](https://www.zembula.com/blog/retention-vs-acquisition-budget-a-ceo-reallocation-framework/) |
Zembula reported average ecommerce ROAS of 2.87, with a median of 2.04, and noted that many businesses need roughly 2.5x to 3x ROAS to break even after gross margin, fulfillment, returns and overhead. The benchmark is a comparison point, not a target for every store. Your break-even ROAS depends on the contribution available before ads.
For example, an order producing $60 of contribution before advertising leaves $40 before fixed costs at 3x ROAS, because the ad cost is $20. At 2x ROAS, advertising costs $30, reducing the remaining contribution by 25%. The product and price stay the same; the ad return changes the result.
To assess whether acquisition costs fit your business, review what counts as a good customer acquisition cost and compare CAC with gross profit from your own customer cohorts.
Same-day test: Pull CAC by channel, contribution per order and live ROAS by campaign. Calculate a minimum ROAS for each product using its actual costs after returns and fees, then pause campaigns below that threshold once enough data has accumulated.
How to Calculate Profit After Returns and Fees
Returns are where healthy-looking margins go to die. The National Retail Federation and Happy Returns report projected U.S. retail returns would total $890 billion in 2024, with retailers estimating 16.9% of annual sales would be returned. On $100,000 of sales, that's about $16,900 of merchandise heading back before reverse shipping, inspection or markdowns cost a cent.
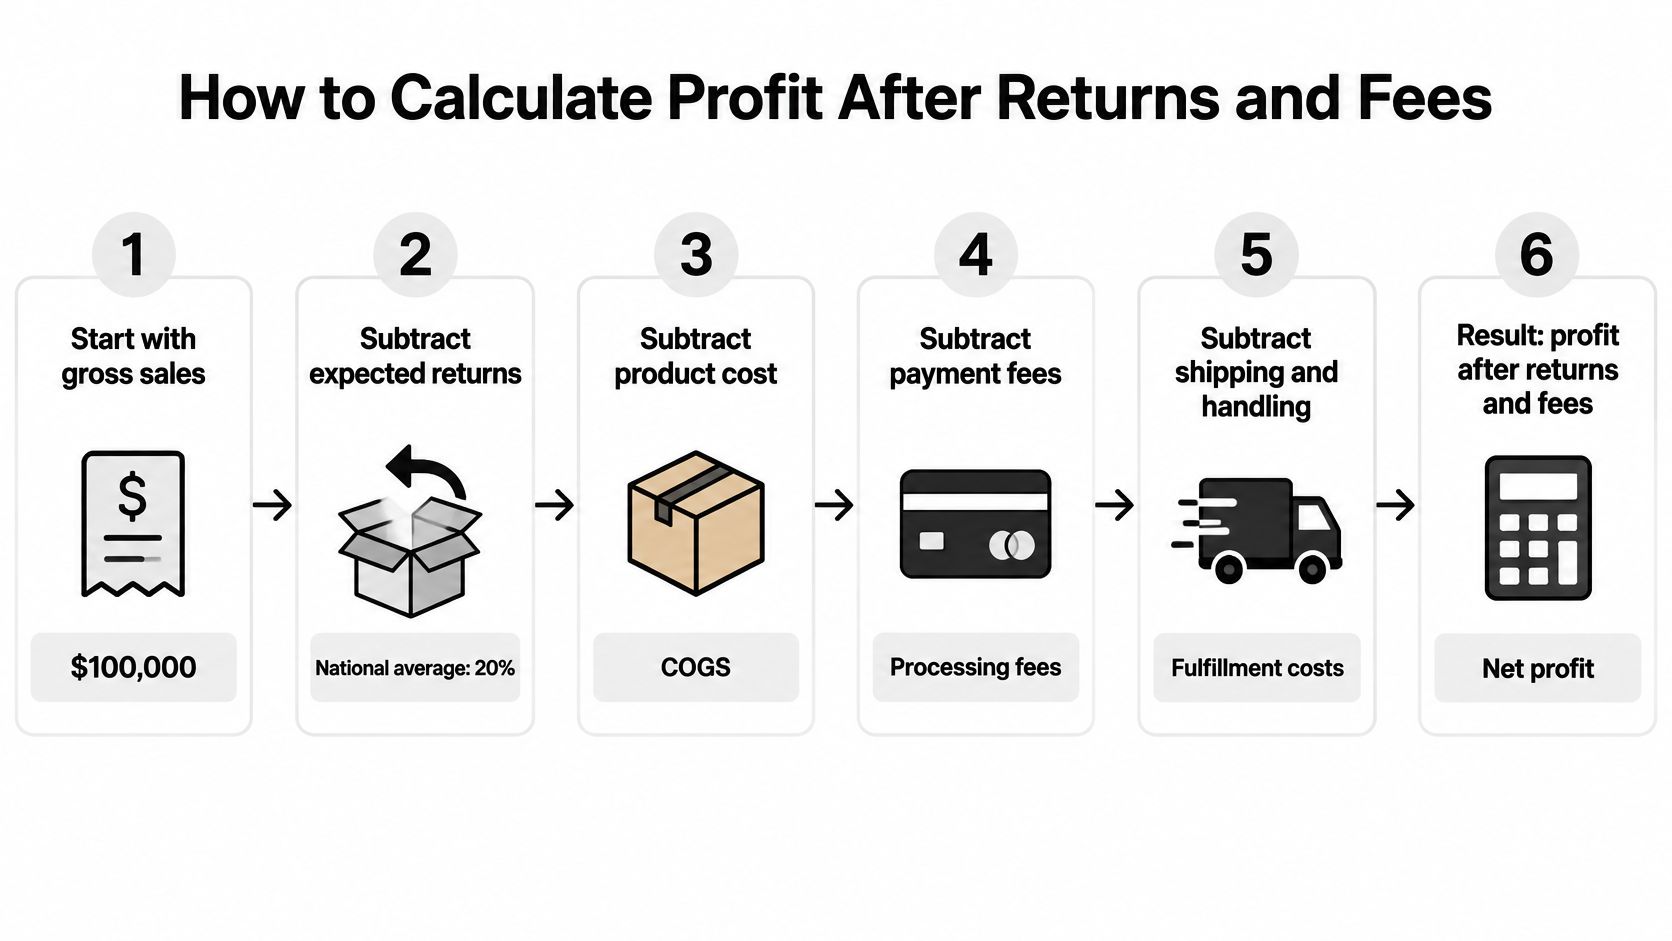
The seven subtractions
- Start with gross sales: Use the full amount customers paid in the period, not the amount the store hopes to keep. Every later line gets measured against this base.
- Apply expected returns: Multiply gross sales by the store's own return rate, or the benchmark above as a placeholder. This is merchandise that re-enters the warehouse instead of staying sold.
- Subtract product cost on kept sales only: Returned goods often resell at a discount or not at all, so charging full product cost against full gross sales flatters the result.
- Subtract payment fees and outbound shipping: These are charged on every order, including the ones that come back. Anyone fuzzy on how carrier pricing stacks up can sanity-check rates against the Aeros Couriers ecommerce shipping guide before locking in a delivery promise.
- Subtract return shipping and processing labor: Someone pays for the label, the inspection, the repackaging and the restocking. If that cost isn't on this sheet, it's hiding in overhead.
- Subtract markdowns, support and fraud losses: A returned item sold as B-stock loses resale value, and support tickets around returns consume paid hours. Both belong in the order economics.
- Divide what remains by gross sales: That percentage is the return-adjusted contribution margin, the figure to compare with the margin assumed when prices were set. It's also the input that makes any return on ad spend calculation honest.
Worked example, return-adjusted contribution on a $100,000 store
| Step | Amount | Why it matters |
|---|---|---|
| Gross sales | $100,000 | Starting base, not profit |
| Expected returns at 16.9% | -$16,900 | Merchandise that re-enters the returns process |
| Product cost on kept sales | Enter cost on $83,100 of kept sales | Only the goods you keep carry product cost |
| Payment fees and outbound shipping | Enter per-order fees times all orders shipped | Charged on every order, whether or not it is returned |
| Return shipping and processing labor | Enter label plus inspection cost times returned orders | Inspection and repackaging cost per return |
| Markdowns, support and fraud losses | Enter resale loss on returned units | Resale value lost on returned goods |
| Return-adjusted contribution margin | Remainder divided by $100,000 | What remains divided by gross sales |
The common slip is using gross sales as the base. It makes a modest gross margin look comfortable right up until returns push the real figure negative.
Same-day test: Run these seven lines for last month, using real return and shipping costs rather than estimates. Then check which single line moved most against the margin assumed at pricing. That line is the first fix, whether it's clearer sizing and compatibility details on product pages or a delivery charge that finally reflects actual carrier costs.
Which Business Models Still Make Money
E-commerce models make money when their cost structure fits how customers buy. Compare the main pressure points and profit sources before choosing a model, then test the result after returns, fees and acquisition costs.
Business models and where their profit comes from
| Model | Main cost pressure | Where profit usually comes from |
|---|---|---|
| Dropshipping | Thin supplier margins, slow delivery, support load | Tight niches with repeat buyers |
| Direct-to-consumer brand | Paid acquisition and returns | Owned product margin and repeat purchase rate |
| Marketplace seller | Platform fees and price competition | Fee-adjusted pricing and fulfillment efficiency |
| Subscription or consumables | Churn and retention spend | Recurring orders with predictable LTV |
| B2B e-commerce | Account onboarding and low order frequency | Contract pricing and reorders |
Dropshipping avoids the cost of holding inventory, but supplier margins are thin and slow delivery can increase support work. Paid acquisition can quickly absorb what remains. The model is more likely to work in a focused niche where customers return, rather than a general store chasing short-lived trends.
Direct-to-consumer brands control their product and pricing, but they also carry the cost of acquiring customers and handling returns. Repeat purchases help spread acquisition costs across more orders. If customers buy only once, the business must keep paying to reach new buyers.
Marketplace sellers gain access to existing demand, while platform fees and visible price comparisons squeeze margins. Build the platform's cut into pricing and account for fulfillment costs, including avoidable storage and split shipments. Sales volume alone does not show whether each order contributes profit.
Subscription and consumables businesses can recover an expensive first sale through repeat orders, provided customers stay. Early cancellations undermine the economics: recurring revenue cannot repay acquisition costs if buyers leave before enough orders. Track the contribution from retained customers, not just the initial order.
B2B e-commerce can involve more onboarding and less frequent orders. Contract pricing and routine reorders can offset those costs, while larger baskets may improve the economics of each sale. A business considering a model change can compare its options against a structured ecommerce growth strategy, using its own order and cost data rather than copying a competitor.
What Amazon's Numbers Show
Amazon's fiscal 2025 annual report reports approximately $716.9 billion in total net sales, including approximately $269.3 billion from online stores, or 38% of total sales. The same report says Amazon Web Services produced $128.7 billion in sales and $45.6 billion in operating income, about 57% of company operating income.
Durable profit at scale came from a high-margin complementary business, not from product sales alone. Smaller stores can apply the same principle by adding services, subscriptions, warranties or paid memberships to product sales. Those additions only help if their revenue exceeds the costs of delivering and retaining them.
Same-day test: Choose the table row closest to your business and identify its largest cost pressure. Then calculate whether the stated profit source contributes after returns, platform fees and ad spend. Use the result to decide whether the model needs a pricing change, lower costs or more repeat purchases.
Which Niches Keep Margin After Returns
Category choice sets the ceiling on profit, because returns don't hit every niche the same way. Sizing, fit and compatibility drive returns in some categories, while others barely see a parcel come back. Two stores with identical gross margins can end the month in completely different places.
Apparel and footwear sit at the hard end. Say a sneaker store sells $100,000 of pairs at an assumed 50% gross margin, and returns take an assumed share of sales that leaves about $83,100 kept. Gross margin on kept revenue is roughly $41,550. Now subtract reverse shipping and inspection, say 200 returned pairs at $12 each, or $2,400, then subtract markdowns on pairs that come back worn, creased or in damaged boxes and can only sell as B-stock.
That remainder, not the original $50,000 of expected gross margin, is the number to compare with break-even. Swap in the store's own figures and the picture either improves or gets uncomfortable fast. Either way, it's honest.
Three checks per category
- Return rate by size or variant: A single badly sized style can poison an otherwise sound category, and the fix is fit data, not more ads.
- Resale value of a returned unit: Sealed consumables and simple accessories go straight back on the shelf, while opened footwear and fitted items lose value immediately.
- Reverse logistics cost per return: Bulky, fragile or low-priced items can cost more to bring back and inspect than they're worth reselling.
Contrast sneakers with a low-return niche like replenishable consumables. The product gets used up, fit isn't a question and reordering is built into the product itself. The same gross margin survives largely intact, and repeat orders arrive without another round of ad spend.
Same-day test: For the top three categories, calculate return-adjusted margin per category rather than for the store as a whole. Keep and promote the categories that clear break-even after returns, and fix sizing guides, dimensions and compatibility details on the worst one before buying it any more traffic.
Where Acquisition and Checkout Costs Leak Profit
Profit leaks when paid acquisition costs more than the order can support, or when checkout friction prevents a ready buyer from completing it. The first leak is easy to miss: campaigns can report revenue while losing money after product costs, returns, fees and ad spend.
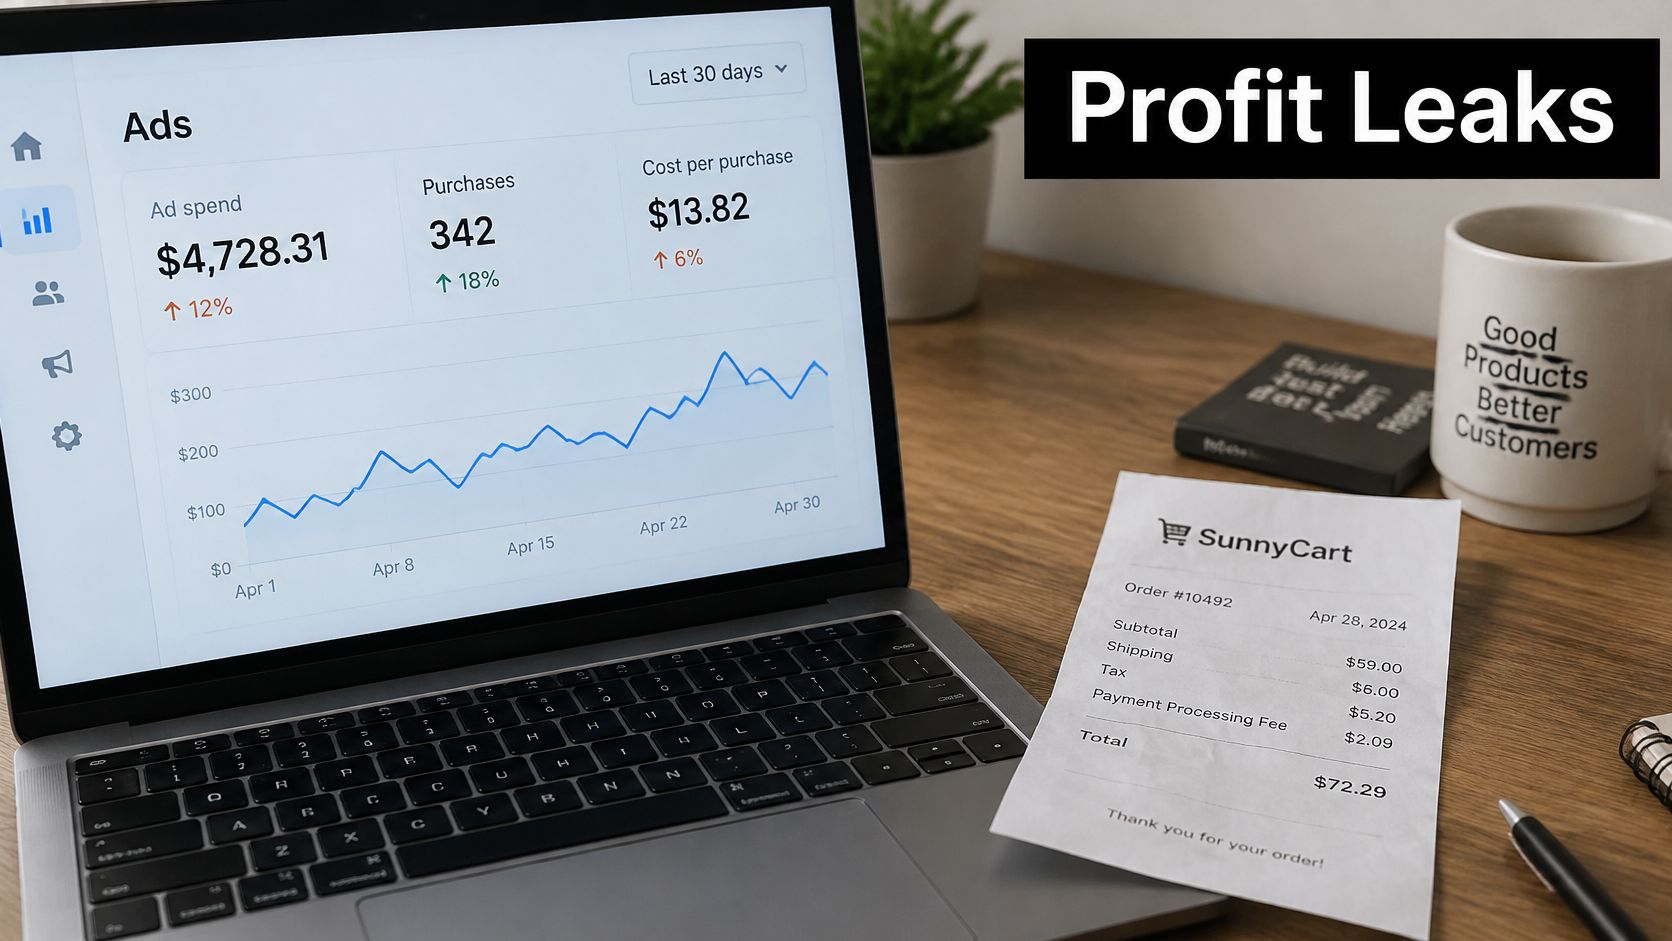
More budget on a campaign below break-even turns a small loss into a bigger one. Use the break-even ROAS from the earlier calculation as the decision point. A lower threshold only makes sense when repeat purchases are measured and reliably profitable, rather than assumed.
Checkout can be a bigger leak than most ad-account fixes because it affects every paid click that reaches the basket. A compilation citing Baymard Institute reports an average documented abandonment rate of 70.22% across 50 studies. The same compilation says 40% of U.S. shoppers cited unexpected shipping, tax and fees as a reason for abandoning checkout. At those rates, about 702 of 1,000 carts are abandoned; recovering 5% would mean roughly 35 additional orders, without paying for more traffic.
The video below shows how operators approach these acquisition and checkout leaks.
<iframe width="100%" style="aspect-ratio: 16 / 9;" src="https://www.youtube.com/embed/ZeaVnJjlxyU" frameborder="0" allow="autoplay; encrypted-media" allowfullscreen></iframe>Four tests worth running
- Show delivery cost and arrival date on the product page: Compare checkout completion with the previous version across the same weekday pattern. This makes it easier to see whether clearer delivery information reduces fee-related drop-off.
- Add guest checkout and digital wallets: Track mobile completion separately to identify whether account creation or payment steps are adding friction.
- Cut form fields: Remove details that are not needed to ship the order or take payment. Check completion at each step, not just the overall conversion rate.
- Send recovery emails showing the full remaining total: Include shipping and tax, not only the product name, and judge results by contribution per recovered order. A structured checkout optimization approach tests one friction point at a time.
Same-day test: Record current checkout completion, then test showing delivery costs and arrival dates earlier. Set a review date and track both conversion and contribution per order. A conversion lift can still reduce profit if it depends on heavier discounts.
Levers That Lift Margin Without More Ad Spend
The cheapest order is the second one. Acquisition is already paid for, the customer already trusts the store and support costs are usually lower because expectations are set. Email, SMS and loyalty programs exist to manufacture that second order on purpose rather than by accident, which is exactly what a proper customer lifetime value analysis makes visible by cohort.
Pricing is the next lever, and it doesn't require discounting. Bundles that solve a complete job, and free-shipping thresholds set just above the break-even basket, lift average order value while protecting margin per parcel. A threshold set below break-even does the opposite, subsidizing small orders that were never going to pay.
Retention and basket size raise profit per customer already won. Ad spend raises the number of customers who still need to become profitable.
Discovery is shifting underneath all of this. DHL's 2025 survey of 24,000 shoppers across 24 markets found about 70% of consumers want AI-powered shopping features, while 61% expected social platforms to become their primary shopping destination by 2030. Assistants and social feeds increasingly decide which products get seen at all.
Those systems rank on product data quality, reviews, availability and delivery promise. Complete titles, accurate attributes, live stock and strong imagery protect visibility, and for apparel brands, better visuals through an ai photoshoot for clothing brand approach can improve how products present without reshooting every season. Thin product data disappears from recommendations.
The caution is that AI-referred shoppers may arrive more price-sensitive, comparison-shopping by design. More assisted traffic could mean lower margin per order rather than more profit. Nobody knows for a given store until it's measured.
How to test whether new discovery traffic pays
- Assisted versus non-assisted sessions: Compare conversion and contribution per session, not just traffic volume.
- Marketplace versus direct contribution: Count fees and returns on both sides before declaring a channel winner.
- Branded versus non-branded demand: Falling branded demand while assisted traffic rises suggests the store is becoming interchangeable.
- New-customer payback after discounts and returns: A channel that needs heavy discounting to convert may never pay back.
Same-day test: Build one 90-day cohort view showing second-order rate and gross profit per customer. If repeat buyers carry the margin, as they usually do, the next euro belongs in retention flows before it belongs in another prospecting campaign.
Run Your Profitability Check This Week
A useful profitability check ends with a decision you can act on, not another round of calculations. Set aside time to review orders, campaign performance and customer cohorts together.
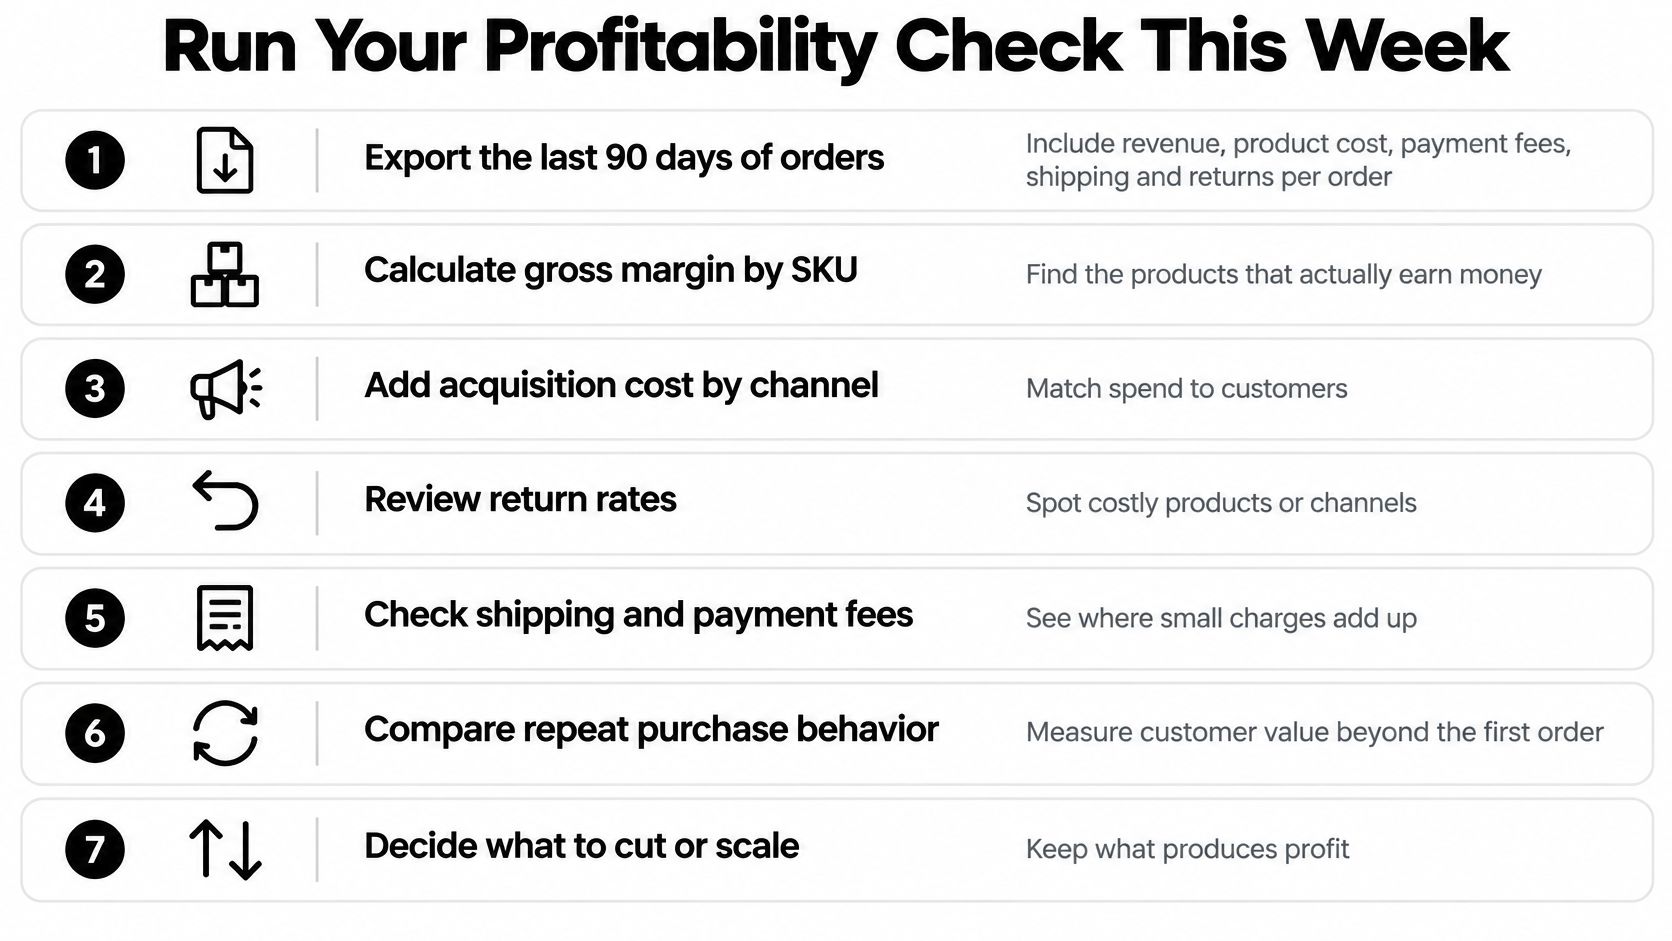
- Export recent order data: Include revenue, product cost, payment fees, shipping and returns for each order.
- Complete the return-adjusted worksheet: Apply the seven subtractions across the same period, so the result reflects the whole business.
- Review product-level ad results: Compare the top five products' break-even ROAS with live performance, and note whether each product meets its margin target.
- Check campaign changes before reallocating budget: Use the account history to identify what changed, and avoid reacting to a short-lived dip.
- Review checkout abandonment: Find the step where shoppers leave, then choose one delivery-cost change to test on product pages.
- Group customers by first-purchase month: Compare LTV with CAC by cohort and look for changes in repeat purchasing.
- Assign one retention or pricing action: Name an owner and set a launch date this month.
Use the results to decide where the next euro should go. Positive contribution after returns and ROAS above break-even support a cautious increase; otherwise, address the largest cost driver first.
Sprints & Sneakers' growth scan identifies a bottleneck, while its Google Shopping and Performance Max campaigns use a structured product feed and ROAS and margin targets set on top of revenue. Tracking links every euro spent to the revenue it generates, and budget shifts toward campaigns and products that perform while ineffective activity is stopped.
Stores that track contribution margin, break-even ROAS and cohort payback manage profitability week by week. Sprints & Sneakers helps e-commerce brands identify bottlenecks, set margin-based targets and connect spend with revenue. Start with a growth scan at Sprints & Sneakers to assess your store's next opportunity.
Related articles


Frequently asked questions
Growth marketing, AI and automation, SEO, performance marketing, retention strategies, and sustainable business practices.
Weekly. Subscribe to our newsletter to get new articles straight to your inbox.
Absolutely. Everything we publish is designed to be actionable. Take it, test it, and make it your own.
Yes. We publish experiments with real numbers. What worked, what didn't, and what we learned.
Our growth team — strategists, performance marketers, data specialists, and AI builders who work on client campaigns every day.
We're open to it. Reach out via our contact page with your topic and we'll take a look.