
Return on Ad Spend: Calculate and Scale Profit
Master return on ad spend with practical formulas, incrementality tests, and full-funnel strategies to scale profitable B2B and e-commerce growth.
The most popular advice about return on ad spend is also the most dangerous: increase the number on the advertising dashboard and assume the business is healthier. A reported ROAS can rise while profit falls, especially when the platform claims sales that would have happened without the ad, or when revenue is measured before product, fulfilment, payroll, and overhead costs.
A better approach treats ROAS as an operating signal, not a final verdict. E-commerce teams need contribution-margin visibility, while B2B SaaS teams need to connect spend to pipeline, closed revenue, retention, and cash payback. The question isn't only, “What did the platform credit?” It's, “What profit did advertising cause?”
Table of Contents
- The Profitability Illusion Behind High ROAS
- Calculating True Return on Ad Spend
- Proving Incrementality Beyond Platform Attribution
- Adapting Measurement for B2B SaaS and E-commerce
- Standardizing Attribution Rules for Accurate Comparisons
- Actionable Levers to Improve Campaign Efficiency
- Building a Mature Testing and Evaluation Timeline
The Profitability Illusion Behind High ROAS
A 4.0x ROAS looks impressive. It means a campaign generated four dollars in attributed revenue for every dollar spent on advertising. It does not prove that the campaign was profitable, and it doesn't prove that advertising caused all of those sales.
Google Analytics defines ROAS as total revenue earned for every dollar spent on advertising, which makes it useful for revenue efficiency but incomplete as a profit metric. A campaign can report positive ROAS while losing money after costs such as goods sold, fulfilment, salaries, agency fees, and overhead are included. Google's explanation of ROAS makes this distinction explicit.
Revenue is not contribution
Consider an e-commerce campaign with 2.0x ROAS. With $100,000 in advertising spend, the campaign reports $200,000 in attributed revenue. If gross margin is 40%, only $80,000 remains before other costs. The advertising investment has already exceeded the available gross profit, before discounts, shipping, customer support, and operating expenses enter the calculation.
That example changes the question from “Did the ads produce revenue?” to “Did the ads produce enough contribution to justify the investment?” The American Marketing Association recommends evaluating net marketing contribution by multiplying incremental revenue by gross margin, subtracting marketing investment, and dividing the result by marketing investment. This is a much more useful lens for budget decisions than revenue-only ROAS.
Practical rule: A campaign should earn its budget with contribution, not with attributed revenue alone.
The same problem appears in lead generation. A staffing agency may report strong conversion value from forms, but that number means little if the leads don't become qualified opportunities. Teams focused on pipeline may get more value from ways to book more client meetings than from celebrating a dashboard metric disconnected from sales outcomes.
Attribution adds another layer of risk
Platform attribution often treats a click or view as evidence that an ad caused a purchase. That conclusion is too strong. A customer may have searched for the brand, visited directly, or planned to buy before seeing the ad. Retargeting campaigns are especially vulnerable because they reach people who already showed buying intent.
The practical consequence is uncomfortable but useful: a campaign with lower reported ROAS may create more incremental profit than a campaign with higher reported ROAS. A prospecting campaign might generate demand that appears later through direct traffic, while a retargeting campaign captures demand that already existed.
ROAS still has a role. It can support daily pacing, creative comparisons, and bid monitoring. It just shouldn't make the final investment decision without contribution margin, customer acquisition cost, payback period, lifetime value, and an incrementality view.
Calculating True Return on Ad Spend
The basic calculation is straightforward:
ROAS = attributed conversion value ÷ advertising cost
If a campaign produces €4,000 in tracked sales from €1,000 in advertising spend, the ROAS is 4.0x, or 400%. Google Ads presents this relationship as conversion value divided by cost, and multiplying the result by 100 expresses it as a percentage. Google's ROAS calculation guidance provides the platform definition.
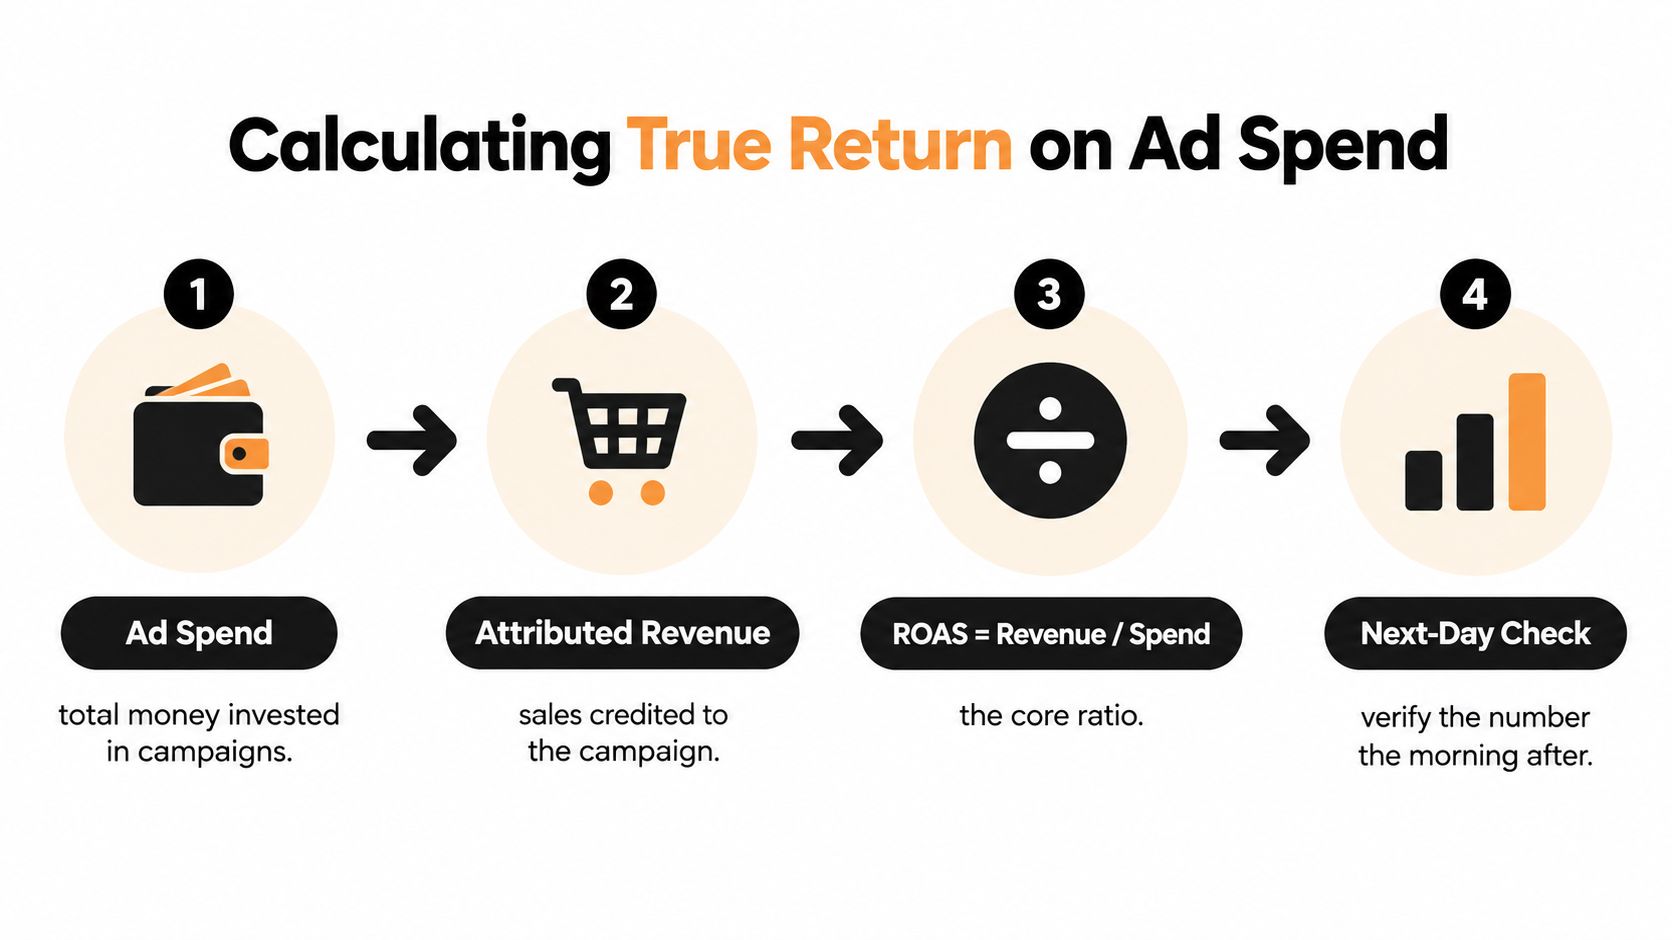
A next-day calculation workflow
A marketing analyst can calculate the operational number the morning after a campaign runs:
- Export ad spend. Use the same date range, currency, and campaign scope.
- Export conversion value. Confirm that the value represents the same conversion event across campaigns.
- Divide conversion value by cost. This produces the ROAS ratio.
- Check the inputs manually. Look for duplicated transactions, refunds, missing purchases, and changes in tracking.
The ratio is only as reliable as the conversion value. If one campaign reports gross sales and another reports profit-adjusted value, comparing them creates a false ranking.
For a more realistic e-commerce view, adjust the value before making a budget decision. Subtract product costs, discounts, taxes, returns, and fulfilment where the business can pass those costs into reporting. The resulting figure can support a contribution-margin ROAS or a profit-on-ad-spend view.
A simple e-commerce example
Suppose an online retailer reports €4,000 in sales from €1,000 of ad spend. The reported ROAS is 4.0x. After product costs and fulfilment, the contribution value is lower. If the retailer evaluates only the platform ratio, it may increase spending on a campaign that has little contribution left after costs.
That doesn't make revenue ROAS useless. It makes the definition visible. Stakeholders should see whether a report uses gross revenue, net revenue, contribution value, or profit, and whether the figures include refunds and discounts.
Teams building a measurement process can also review these strategies to track campaign returns and compare them with the organisation's own finance definitions. A useful internal reference on marketing ROI calculation can help align the marketing and finance teams before campaign results are ranked.
<iframe width="100%" style="aspect-ratio: 16 / 9;" src="https://www.youtube.com/embed/no_XV8MVudo" frameborder="0" allow="autoplay; encrypted-media" allowfullscreen></iframe>The reporting sheet should contain both numbers: platform-reported ROAS for operational monitoring and contribution-based return for investment decisions. That separation prevents teams from hiding margin pressure inside a single attractive ratio.
Proving Incrementality Beyond Platform Attribution
A high platform ROAS can reflect credit assignment rather than genuine demand. Platform attribution answers a narrow question: which ads received credit under a platform's rules? This guide to marketing attribution explains how those rules are built. Incrementality answers the question budget owners need: how many outcomes happened because of advertising?
A major academic study analysed 25 large field experiments involving major U.S. retailers and brokerages. The experiments reached millions of customers and represented $2.8 million in digital advertising expenditure. The median confidence interval around estimated advertising return was wider than 100 percentage points, while a coefficient of variation of 10 was common for individual-level sales relative to advertising cost. The academic study on advertising returns shows why a precise dashboard ratio can conceal substantial uncertainty.
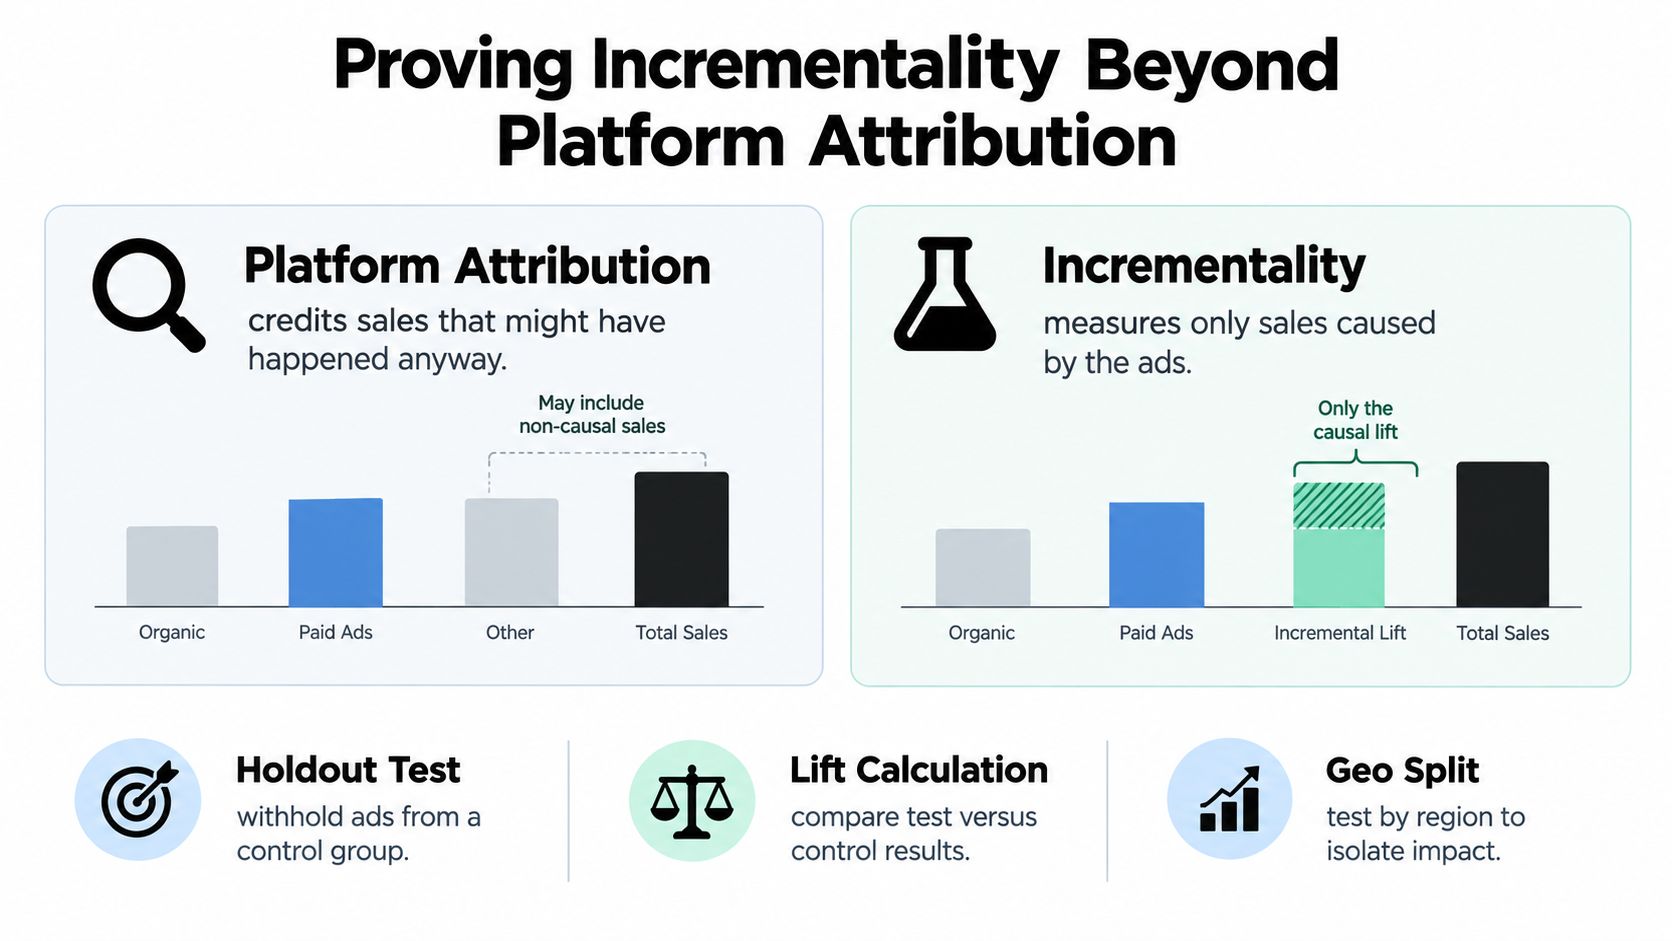
What a useful test looks like
A holdout test withholds advertising from a carefully selected control group while the test group remains exposed. The difference in outcomes estimates ad-driven lift, rather than counting all sales among people who saw an ad.
A geo experiment assigns regions or markets to test and control groups. The team keeps targeting, offer, timing, and conversion definitions consistent, then compares changes between regions. This approach helps when user-level holdouts are unavailable, although regional differences require careful treatment.
A conversion-lift study compares exposed and unexposed audiences under a defined measurement design. Set the control logic before results appear. Otherwise, teams may change the audience, measurement window, or outcome definition after seeing an inconvenient result.
How to interpret weak results
A negative or inconclusive lift result does not automatically mean the campaign failed. The audience may already have been likely to convert, the test may lack sufficient statistical power, or the conversion window may be too short for the buying cycle.
The result still improves budget decisions. High platform ROAS with no measurable lift should prompt caution, particularly for branded search and retargeting. Lower platform ROAS with positive incremental lift may deserve more investment when the added contribution exceeds media cost.
Industry measurement data shows how common this gap remains. Platform attribution is used by 65.8% of marketers, while 67.4% identify proving incremental ROI as a leading challenge. Only 52.0% use incrementality tests and 49.5% use marketing mix modeling, according to reported marketing measurement findings.
A mature measurement program keeps platform reporting for account management, then checks it against holdouts, geo tests, conversion-lift studies, and marketing mix modeling. The platform number supports day-to-day optimisation. Incrementality evidence determines whether additional budget is creating new demand and profit.
Adapting Measurement for B2B SaaS and E-commerce
A universal ROAS target is a poor management tool because business models create value on different timelines. An e-commerce retailer can often observe a transaction quickly. A B2B SaaS company may wait through qualification, opportunity creation, procurement, implementation, and renewal before the financial result is clear.
The B2B SaaS framework
B2B teams should separate three layers of value:
- Pipeline ROAS: qualified pipeline value divided by advertising spend. This is an early signal, not booked revenue.
- Closed-won ROAS: closed-won revenue attributed to advertising divided by spend. The team must define attribution and cohort maturity.
- Contribution and payback: gross-margin contribution from acquired customers compared with acquisition cost and the time required to recover it.
CRM linkage is essential. Recent B2B benchmark reporting found that 42 of 132 advertisers had no CRM opportunity signal connected to lead-generation spend, leaving their advertising disconnected from outcomes beyond the lead stage. The figure appears in B2B advertising measurement reporting, which also shows why channel comparisons depend on the underlying method.
A lead isn't equivalent to revenue. A campaign attracting senior buyers with fewer submissions may produce stronger pipeline than a campaign generating many low-intent forms. The reporting model should pass campaign, audience, and creative data into the CRM, then connect those records to opportunity stage, expected value, closed revenue, gross margin, and retention.
The e-commerce framework
E-commerce teams usually need faster feedback, but speed doesn't remove the need for margin discipline. The reporting model should distinguish:
| Measurement layer | Business question |
|---|---|
| Revenue ROAS | How much tracked sales value did the campaign receive? |
| Contribution-margin ROAS | How much value remained after direct selling costs? |
| Cohort value | Do acquired customers purchase again or return products? |
| Cash payback | How quickly does the business recover acquisition spend? |
The same benchmark reporting attributed 113% ROAS to LinkedIn, 78% to Google Search, and 29% to Meta, while including LinkedIn engagement data reportedly increased attribution accuracy 7.7-fold. These are not universal benchmarks. They demonstrate that revenue definitions, attribution models, engagement signals, and cohort maturity can change the apparent winner.
A retailer and a SaaS company should therefore avoid copying generic targets. Teams evaluating lifetime economics can use this guide to measure customer lifetime value, then choose a ROAS threshold that reflects margin, retention, and cash constraints.
Standardizing Attribution Rules for Accurate Comparisons
Campaign comparisons become unreliable when each campaign uses a different definition of success. A 7-day click ROAS and a 30-day view-through ROAS don't measure the same thing, even if both appear in the same dashboard.
The IAB and MRC retail-media guidance recommends clearly disclosed attribution windows such as 3, 7, 14, 28, or 30 days. It also says that viewable impressions are required when attributing outcomes to ad exposures, while results based on non-viewable impressions should carry a disclaimer. The IAB and MRC measurement guidance provides the relevant measurement principles.
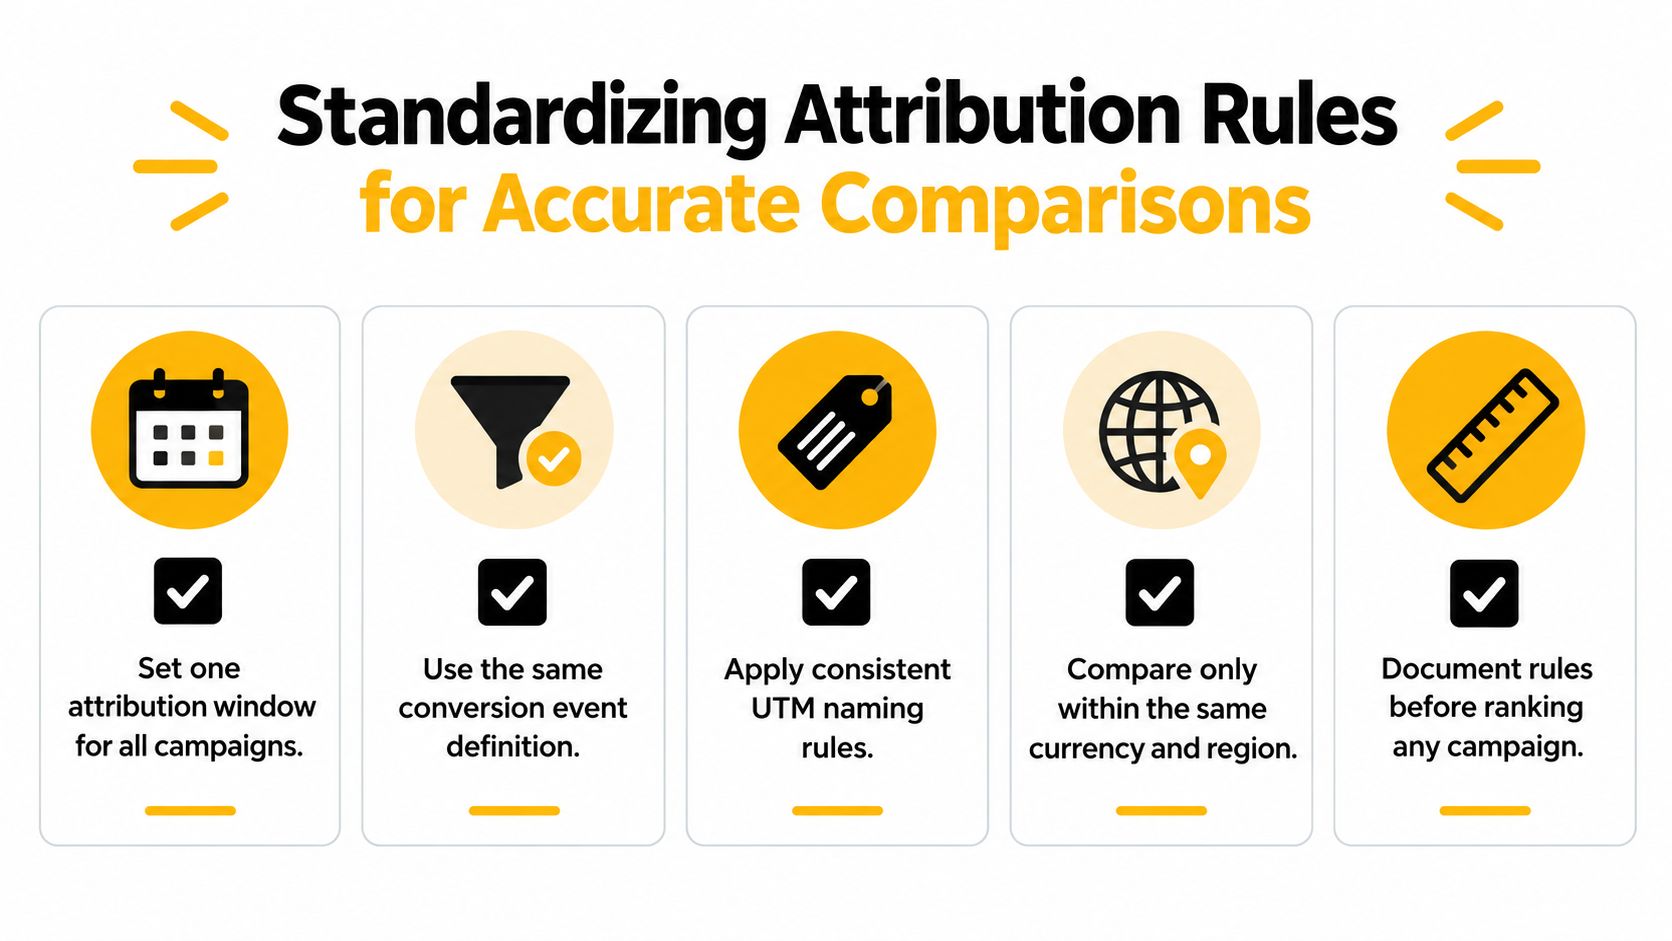
The comparison checklist
Before ranking campaigns, an analyst should document:
- Attribution window: Choose one click and view window for the comparison.
- Conversion event: Define whether the report uses purchase, qualified lead, opportunity, or another outcome.
- Viewability rule: Credit exposures only when the agreed viewability condition is met.
- Currency and region: Compare campaigns within the same currency and geographic scope.
- Reporting status: Mark observed revenue separately from modeled or estimated value.
The team should record the platform, conversion event, attribution window, viewability rule, currency, and date range in every report. That small discipline prevents a campaign from appearing better only because it receives a longer window or broader credit.
Attribution settings should be frozen before a test begins. If analysts change the window after seeing performance, the result becomes a moving target. Campaigns can still use different operational setups, but those campaigns shouldn't be ranked together until the data has been normalised.
Actionable Levers to Improve Campaign Efficiency
Higher ROAS can hide weak economics. Campaign efficiency improves when creative, audience quality, landing-page conversion, and conversion data reinforce one another, while decisions remain tied to qualified outcomes and contribution.
Start with the message, then isolate the variable under test. Change one meaningful element at a time, such as the problem statement, proof point, offer, or call to action. If the audience and landing page change simultaneously, performance movement becomes difficult to explain. B2B creative should qualify the buyer and the problem. E-commerce creative should clarify product value and reduce purchase friction.
Match the lever to the failure
Use the funnel to locate the constraint:
- High impressions, weak clicks: test the promise, visual hierarchy, and audience relevance.
- Strong clicks, weak conversion: inspect message match, page speed, offer clarity, trust signals, and form friction.
- Conversions without qualified outcomes: revise targeting and conversion definitions instead of increasing bids.
- Good revenue, weak contribution: prioritise margin-aware values, product mix, and customer quality.
Landing-page changes need the same testing discipline as ads. The page should repeat the ad's promise, answer the buyer's main objection, and make the next action obvious. No bid strategy can compensate for a broken checkout or an unclear demo form.
Decide when automation deserves control
Automated bidding can help when conversion tracking is accurate, reliable signals are available, and each conversion carries a value aligned with business priorities. It can amplify poor inputs as efficiently as useful ones. Duplicate leads, weak lead-quality signals, or revenue values that ignore margin can push automation toward the wrong outcome.
Manual controls remain useful during early testing, limited-volume campaigns, and periods of unreliable tracking. Once the signal is trustworthy, automation can handle routine bid decisions while the team concentrates on creative, offers, audiences, and funnel strategy.
Teams looking for a practical pay per click guide for SMEs can use it as a starting point, then adapt the process to their own conversion data. A focused Google Ads optimisation framework should connect bid changes to contribution and qualified outcomes, not just clicks.
Full-funnel coordination protects measurement quality. Awareness campaigns should build identifiable audiences, consideration campaigns should answer objections, and retargeting should support conversion without receiving automatic credit for every sale. Separate demand creation from demand capture, then judge each role by its contribution to incremental profit rather than platform-reported ROAS alone.
Building a Mature Testing and Evaluation Timeline
Campaigns often get judged before they have enough evidence to support a decision. The first few days can contain uneven traffic, delayed conversions, incomplete revenue data, and unstable delivery. Cutting a campaign during that period may remove a promising test, while scaling it too quickly may amplify noise.
Google's Shopping guidance says Target ROAS requires conversion tracking and at least 15 conversions per Merchant Center ID during the previous 30 days before activation. Google also recommends using roughly the previous four weeks of average conversion-value-per-cost data when selecting a target, then reporting values across all relevant campaigns for four weeks or three conversion cycles, whichever is longer, before determining the target and evaluating performance. Google's Target ROAS guidance sets out those requirements.
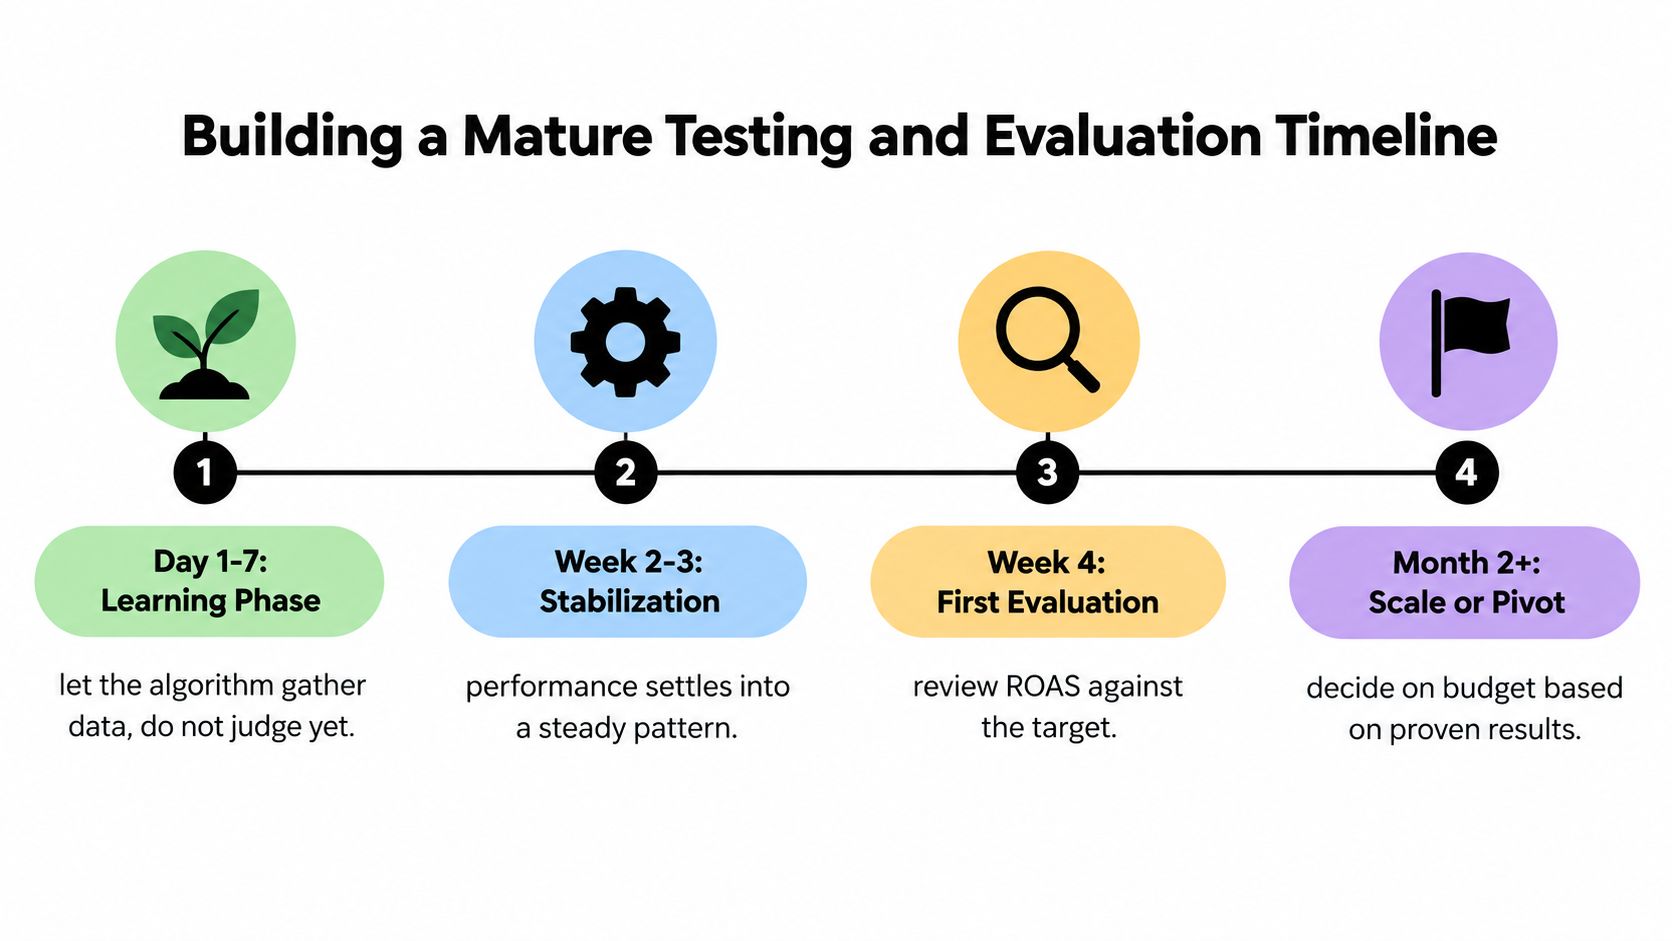
A practical evaluation rhythm
A team launching a new campaign can use this sequence:
- Days 1 to 7: Check tracking, spend pacing, search terms or audience delivery, creative approval, and conversion quality. Avoid making a major ROAS judgment from incomplete data.
- Weeks 2 to 3: Review whether delivery is stabilising and whether the campaign is collecting the intended conversion signals.
- Week 4: Compare reported ROAS, contribution value, qualified outcomes, and any available incrementality evidence against the agreed target.
- Month 2 onward: Increase budget, hold, or pivot based on repeated results and business constraints.
The timeline isn't a licence to ignore serious problems. Broken conversion tracking, accidental targeting, fraudulent traffic, or clearly irrelevant leads require immediate action. Patience applies to statistical evaluation, not to obvious implementation errors.
Before enabling target-based automation, the team should verify value passing, confirm conversion volume, define the target from an appropriate historical period, and agree how long the campaign will run before review. A structured A/B testing approach for marketing can help separate genuine performance changes from normal variation.
The final scorecard should show platform ROAS, contribution-margin return, incremental lift where tested, qualified pipeline or repeat purchase behaviour, and payback. That combination keeps daily optimisation fast while ensuring major budget decisions reflect profit rather than dashboard theatre.
Sprints & Sneakers helps B2B and B2C teams connect paid media, analytics, CRO, and full-funnel experimentation to measurable growth outcomes. Visit Sprints & Sneakers to assess where attribution, conversion, or campaign efficiency is limiting profitable scale.
Related articles


Frequently asked questions
Growth marketing, AI and automation, SEO, performance marketing, retention strategies, and sustainable business practices.
Weekly. Subscribe to our newsletter to get new articles straight to your inbox.
Absolutely. Everything we publish is designed to be actionable. Take it, test it, and make it your own.
Yes. We publish experiments with real numbers. What worked, what didn't, and what we learned.
Our growth team — strategists, performance marketers, data specialists, and AI builders who work on client campaigns every day.
We're open to it. Reach out via our contact page with your topic and we'll take a look.