
Marketing Funnel Optimization That Actually Moves Revenue
A tactical playbook for marketing funnel optimization across every stage. Find bottlenecks, prioritize experiments, and lift conversion
Most funnel programs don't fail because teams lack ideas. They fail because teams improve the wrong stage first. A polished landing page won't rescue a checkout that hides delivery costs, and more traffic won't fix a sales process that loses qualified buyers after the demo.
Marketing funnel optimization works better as a bottleneck discipline. Find the largest loss of qualified users, form a test around the mechanism causing it, measure the commercial result, then move to the next constraint. That approach also exposes two areas generic funnel advice often misses: pre-contact preference, before a buyer fills in a form, and decision-making when privacy restrictions and AI-mediated research make attribution incomplete.
Table of Contents
- The Bottleneck-First Mindset That Beats Spreading Thin
- Mapping the Six Funnel Stages to Observable Events
- Diagnosing Drop-Offs in GA4 Without Fooling Yourself
- Why the Funnel Starts Before You Know It
- A Prioritization Framework That Respects the Bottleneck
- A Checkout Audit You Can Run This Week
- Measuring Rigorously When Attribution Is Incomplete
The Bottleneck-First Mindset That Beats Spreading Thin
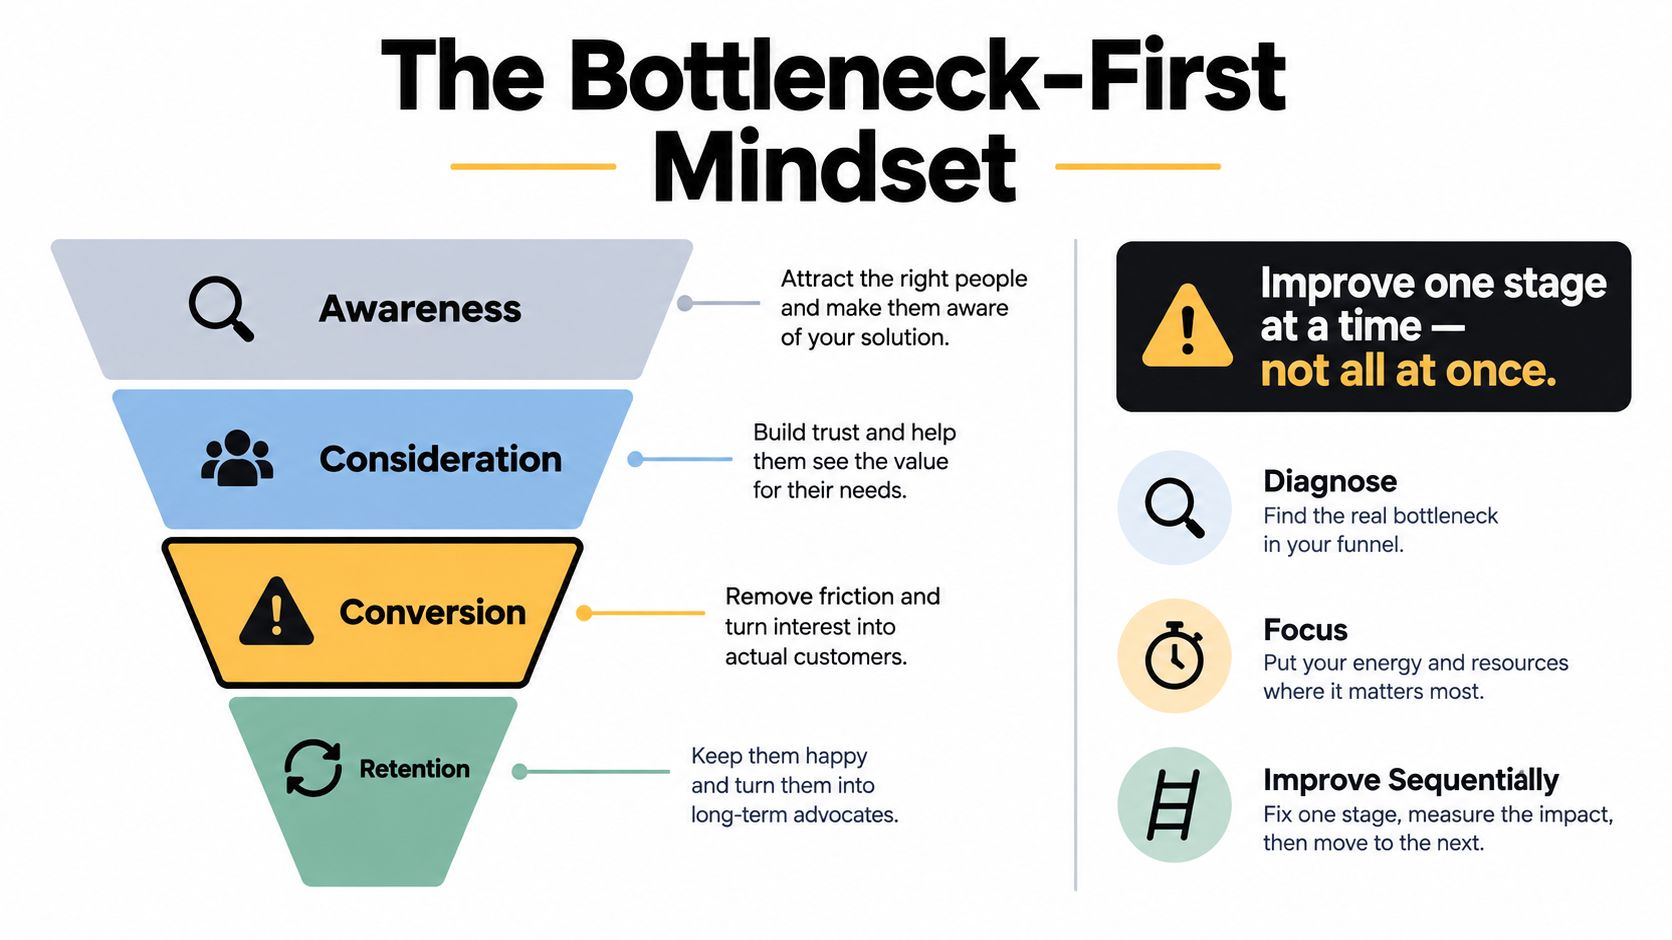
Teams often open a funnel dashboard and create a shopping list. Awareness needs better content. Acquisition needs new audiences. Activation needs onboarding. Revenue needs stronger offers. Retention needs more lifecycle messaging. Everything becomes urgent, so nothing receives enough attention to produce a clean learning cycle.
A bottleneck-first program makes a harder choice. It asks which stage currently removes the greatest number of qualified users, not which stage has the most visible activity. A high-volume awareness channel may look impressive while a small conversion step blocks revenue. The right priority is the step where a focused improvement can release the most valuable demand.
A quick diagnosis before the next meeting
Export the latest stage-to-stage counts and ask four questions:
- Where does qualified intent disappear? Look for the largest meaningful loss, not the lowest percentage.
- Is the loss behavioral or technical? A broken event, slow page, unclear offer, or poor fit creates very different tests.
- Does the loss vary by segment? Device, source, company size, product plan, and campaign can reveal a bottleneck hidden by aggregate reporting.
- What downstream result defines success? A higher form completion rate means little if sales acceptance, margin, retention, or win rate deteriorates.
A useful self-diagnostic fits on one page. List each stage, the event proving progression, the current conversion rate, the next commercial outcome, and the owner responsible for investigating the gap. If the team can't agree on an event or denominator, the problem is measurement quality before it's optimization quality.
Practical rule: One active bottleneck, one primary hypothesis, one guardrail metric, and one owner create more learning than a dozen loosely monitored tests.
The broader Pirate Funnel framework helps teams name the complete journey without turning every stage into a simultaneous project. Bottleneck-led testing compounds because each resolved constraint changes the conditions for the next stage. Parallel testing often dissipates budget across small wins that never combine into a material revenue improvement.
Mapping the Six Funnel Stages to Observable Events
A funnel stage is only useful when a team can observe the behavior that proves it happened. “Consideration” is a planning label. A product comparison viewed, a pricing interaction, or a completed qualification event is evidence.
The six-stage map below works across B2B, SaaS, e-commerce, and consumer journeys. The events need local definition, but the discipline stays consistent: assign an owner, specify the system of record, and choose one primary KPI that reflects progression rather than surface activity.
| Stage | Observable event | Primary KPI | Primary data source |
|---|---|---|---|
| Awareness | Qualified reach, branded discovery, or first meaningful content interaction | Qualified reach or branded demand trend | Ad platforms, search data, analytics |
| Acquisition | Qualified session, account creation, or identified visitor meeting fit criteria | Qualified acquisition rate | Analytics, CRM, customer data platform |
| Activation | First value event, such as a completed setup, product action, or meaningful content interaction | Activation rate | Product analytics, CRM, analytics |
| Revenue | Closed-won order, subscription, or purchase | Revenue conversion rate | CRM, commerce platform, finance system |
| Retention | Repeat purchase, renewal, or sustained usage threshold | Retention or repeat-purchase rate | Commerce platform, product analytics, CRM |
| Referral | Referral-link creation, review submission, or attributable recommendation | Referral contribution | Referral system, CRM, customer platform |
Build the event map before choosing tactics
Start with the commercial outcome and work backward. For a B2B SaaS company, “revenue” might require a closed-won opportunity, while “activation” could mean a user completes the first value-producing workflow. For an online retailer, activation may be adding a product to the cart, but revenue only exists after payment confirmation.
Every event needs a clear definition. “Demo requested” should specify whether it means form submission, a validated request, or a meeting accepted by sales. “Retained” should identify the repeat purchase or product behavior that indicates continued value. Ambiguous events create false confidence because different teams report different versions of the same stage.
A concise sales funnel explained simply can help new stakeholders understand the basic progression, but experienced teams still need their own event dictionary. The dictionary should record event name, trigger, required properties, exclusion rules, owner, and destination system.
Keep the KPI set deliberately small
A stage can have supporting diagnostics, but it needs one primary KPI. Awareness may require reach quality and branded demand, acquisition may require qualified sessions, and activation may require a value event rather than a sign-up. Revenue should connect to actual commercial records, while retention and referral should show whether the initial conversion created durable value.
The lifecycle marketing strategy becomes much easier to operationalize when these events connect across systems. Marketing sees the acquisition signal, sales sees qualification, product sees activation, and customer success sees retention without inventing separate definitions.
Diagnosing Drop-Offs in GA4 Without Fooling Yourself
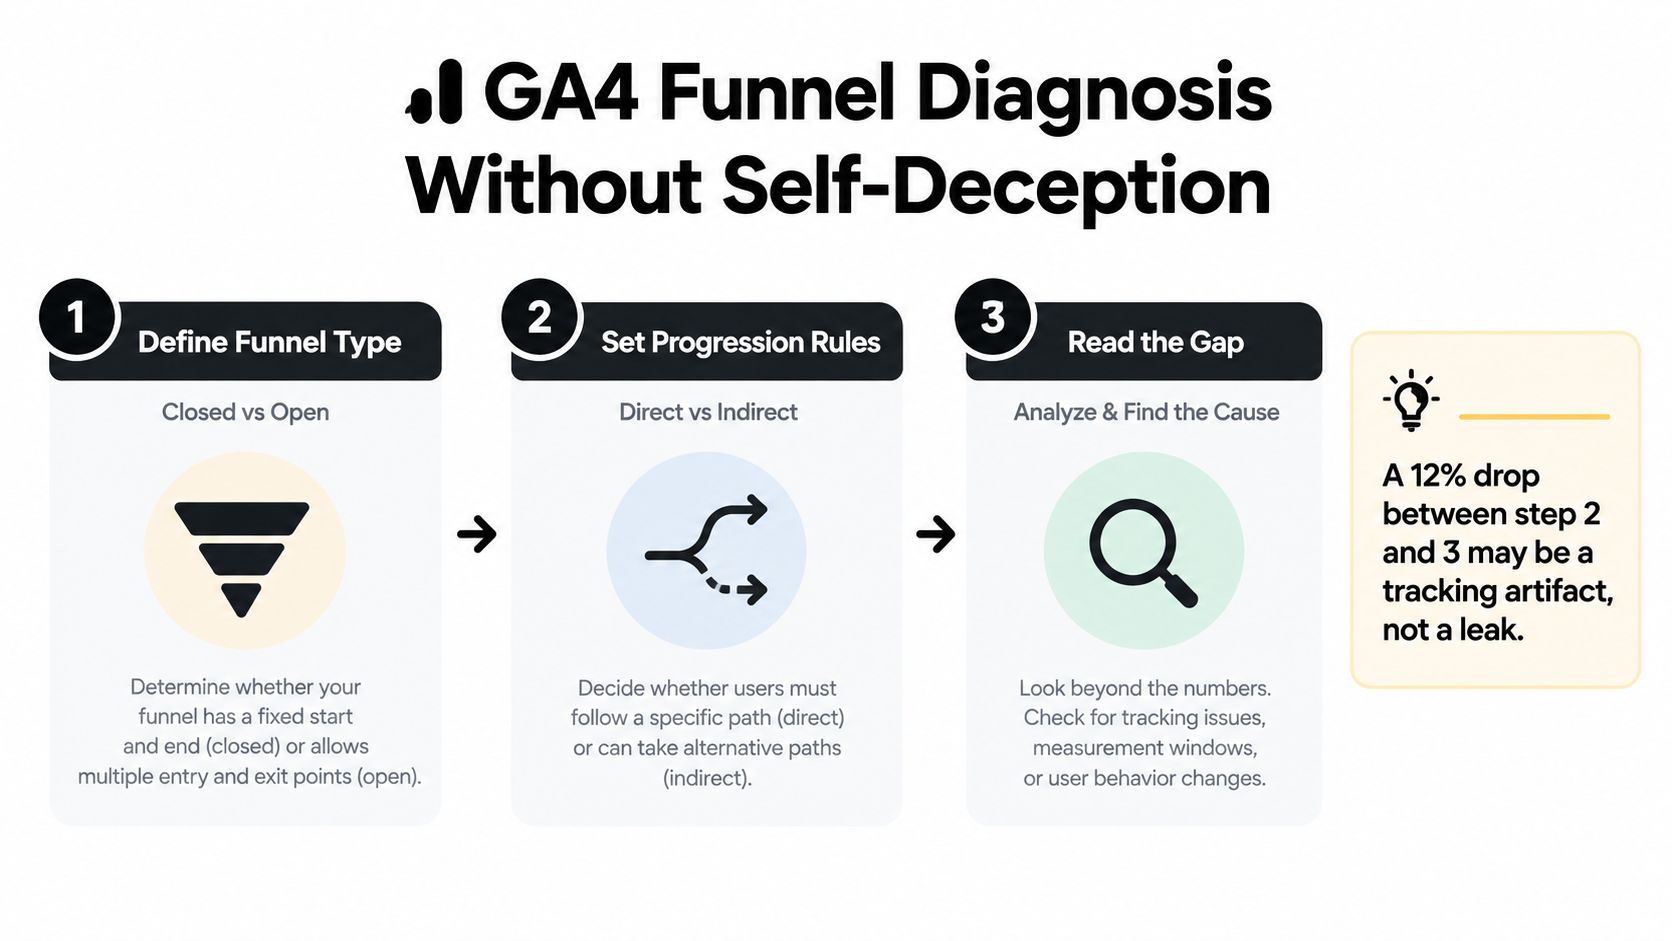
A funnel report can look precise and still be wrong. The definition of the funnel changes what the report includes, and the progression rule changes which behaviors count as movement between steps.
For a B2B SaaS company, define five events: landing-page visit, demo-form start, demo-form submission, qualified sales meeting, and opportunity creation. Funnel exploration tools typically support up to 10 steps, open or closed definitions, and direct or indirect progression, which is enough flexibility to create either a clean view or a misleading one.
Change the definition before changing the budget
A closed funnel requires entry at the first step. It answers whether users who arrived through the campaign landing page moved through the intended journey. An open funnel allows entry at any step, so it captures people who entered through pricing, organic content, direct traffic, or a sales referral.
Those views answer different questions. A closed funnel may show a severe loss between landing-page visit and form start, while the open funnel may show that many qualified buyers skip the landing page and begin on the pricing page. Cutting pricing investment because it does not appear in the closed campaign journey would be a measurement error.
Progression rules create another distinction. Direct progression requires the next event to follow immediately. Indirect progression allows intervening actions, such as reading a case study or checking pricing before submitting the form. Direct progression can expose a broken confirmation flow. Indirect progression better represents a real buying journey.
Slice the gap until the mechanism appears
Review the same funnel by device, source, company size, and campaign. A mobile-only loss suggests interaction or form friction. A source-specific loss may indicate message mismatch. A company-size pattern can expose qualification problems, while a campaign pattern may point to promise continuity between ad and landing page.
The morning review should end with one action, not a long list of observations. If the largest qualified-user loss occurs at demo-form submission, inspect fields, validation, page speed, and qualification language. If the loss occurs between meeting and opportunity, examine sales follow-up, fit criteria, and the information buyers need before progressing.
A reported gap is not a diagnosis until the team can explain the user behavior or system failure behind it.
Last-click reporting can also hide useful assistance from earlier channels. Path-based reporting models use ordered conversion paths and expose time lag and path length, as described in Google's conversion-path documentation. A path such as paid search to direct visit to demo request deserves different treatment from a channel that produces visits but rarely appears in converting sequences.
The marketing analytics resource helps align the reporting layer with the decision layer. Dashboards describe what happened. Funnel exploration and path analysis should determine what gets tested next.
Why the Funnel Starts Before You Know It
A buyer can already have a preferred vendor before submitting a lead form. Industry buyer-journey research found that 68% of B2B buyers already had a front-runner at the start of the purchasing process, and that front-runner won 80% of the time. The same research also reports that 61% of B2B buyers prefer a rep-free buying experience, while 69% see inconsistencies between website and seller information. Those findings appear in Forrester's analysis of building buyer preference.
That changes the first question in funnel work. Traffic, MQL volume, and last-click conversions show visible activity, but they can miss the moment a buyer decides which vendors even belong on the shortlist. A company can generate demand and still lose before the form exists.
Optimize the information buyers use alone
Technical and commercial content has to work without a salesperson standing beside it.
The practical tests are straightforward:
- Comparison pages: Name real trade-offs instead of treating every alternative as worse.
- Pricing or qualification guidance: Give enough commercial context for buyers to judge whether a conversation is worth their time.
- ROI tools: Let a buyer test assumptions that procurement or finance will challenge later.
- Implementation evidence: Explain dependencies, onboarding effort, ownership, and likely obstacles.
- Message synchronization: Make sure the website, sales deck, proposal, and discovery conversation describe the same product and commercial reality.
Good self-serve content does not replace sales. It gives sales a more informed buyer and cuts the credibility damage caused by contradictory information.
Create a shortlist scorecard
Review the scorecard quarterly with marketing, sales, and customer-facing leaders:
- Ask target buyers which vendors they considered before contacting the company.
- Track branded search and direct engagement among target accounts.
- Compare shortlist inclusion with qualified pipeline and win rate.
- Audit website claims against current sales and implementation language.
- Interview recent wins and losses about what shaped preference before contact.
This is pre-contact optimization. It measures whether the company enters the buying conversation with an advantage, not just whether it captures a name.
A Prioritization Framework That Respects the Bottleneck
If the funnel has one hard constraint, spreading tests across three stages is how teams stay busy and stay stuck. ICE and RICE help collect ideas, but they rarely force the harder question: which stage is leaking qualified demand badly enough to deserve attention first?
A bottleneck-weighted grid fixes that. Score each test on expected impact, confidence, effort, and stage-leak severity. That last factor should reflect the gap between current progression and a credible internal reference, such as a stronger segment, a previous baseline, or an operational standard the team already trusts. The goal is not precision for its own sake. The goal is to stop an easy, attractive test from beating a harder fix at the largest constraint.

Use the grid to create a sequence
Good prioritization also has to respect how buyers move now. Some of the highest-value fixes sit before lead capture, where preference is formed but attribution is weak. Others sit later, where measurement is cleaner but the addressable loss is smaller. A useful grid handles both realities. It lets the team sequence work under incomplete attribution instead of defaulting to whatever has the neatest dashboard.
A practical scoring row includes:
- Hypothesis: What change should alter user behavior, and why?
- Stage and leak: Where does the loss occur, and how severe is it?
- Primary metric: Which event should improve?
- Guardrail: What outcome prevents a false win?
- Minimum detectable effect: What size of change would justify rollout?
- Effort and confidence: How quickly can the team learn, and how strong is the evidence?
Consider three tests:
| Test | Hypothesis | Primary metric | Guardrail |
|---|---|---|---|
| Hero CTA rewrite | Connecting the call to action to a specific value moment will increase qualified starts | Qualified CTA-to-form-start rate | Sales acceptance or meeting quality |
| Pricing-page restructure | Clear qualification paths will help self-serve buyers choose the right next step | Pricing-to-qualified-action rate | Sales-cycle length |
| Event-triggered activation email | Sending after the first value event will outperform a signup-timed message | Activation completion rate | Retention or support burden |
The order depends on the constraint. Put the CTA test first when the right audience lands but hesitates at the next action. Move the pricing test up when buyers consume commercial content, compare options, and still avoid contact or purchase. Prioritize the activation email when acquisition is healthy but new users fail to reach value after signup.
Personalization should follow the leak
Personalization earns its place only when it addresses the active constraint. Recent personalization research found that 71% of consumers expect personalized interactions, 76% become frustrated when those interactions are absent, 76% said personalized communications influenced brand consideration, and 78% said personalized content made them more likely to repurchase, as shown in McKinsey's research on getting personalization right.
The same research reported that faster-growing companies generated 40% more revenue from personalization activities than slower-growing peers, and that observed personalization results often produced a 10% to 15% revenue lift across industries, with variation by sector and execution. That supports a narrower approach than many teams take. Personalize where the leak is largest. If the bottleneck is pre-contact preference, use messaging, proof, and qualification paths that match what the buyer is already trying to resolve. If the problem sits later in an AI-mediated, privacy-limited journey, use personalization where you can still observe behavior clearly enough to judge whether it improved the decision path, not just the click rate.
A Checkout Audit You Can Run This Week
Checkout problems are often the fastest revenue leak to diagnose because the intent is already there. A compilation of 50 studies puts average abandonment at 70.22%, and the documented reasons translate cleanly into tests you can run this week in Baymard's checkout UX statistics.
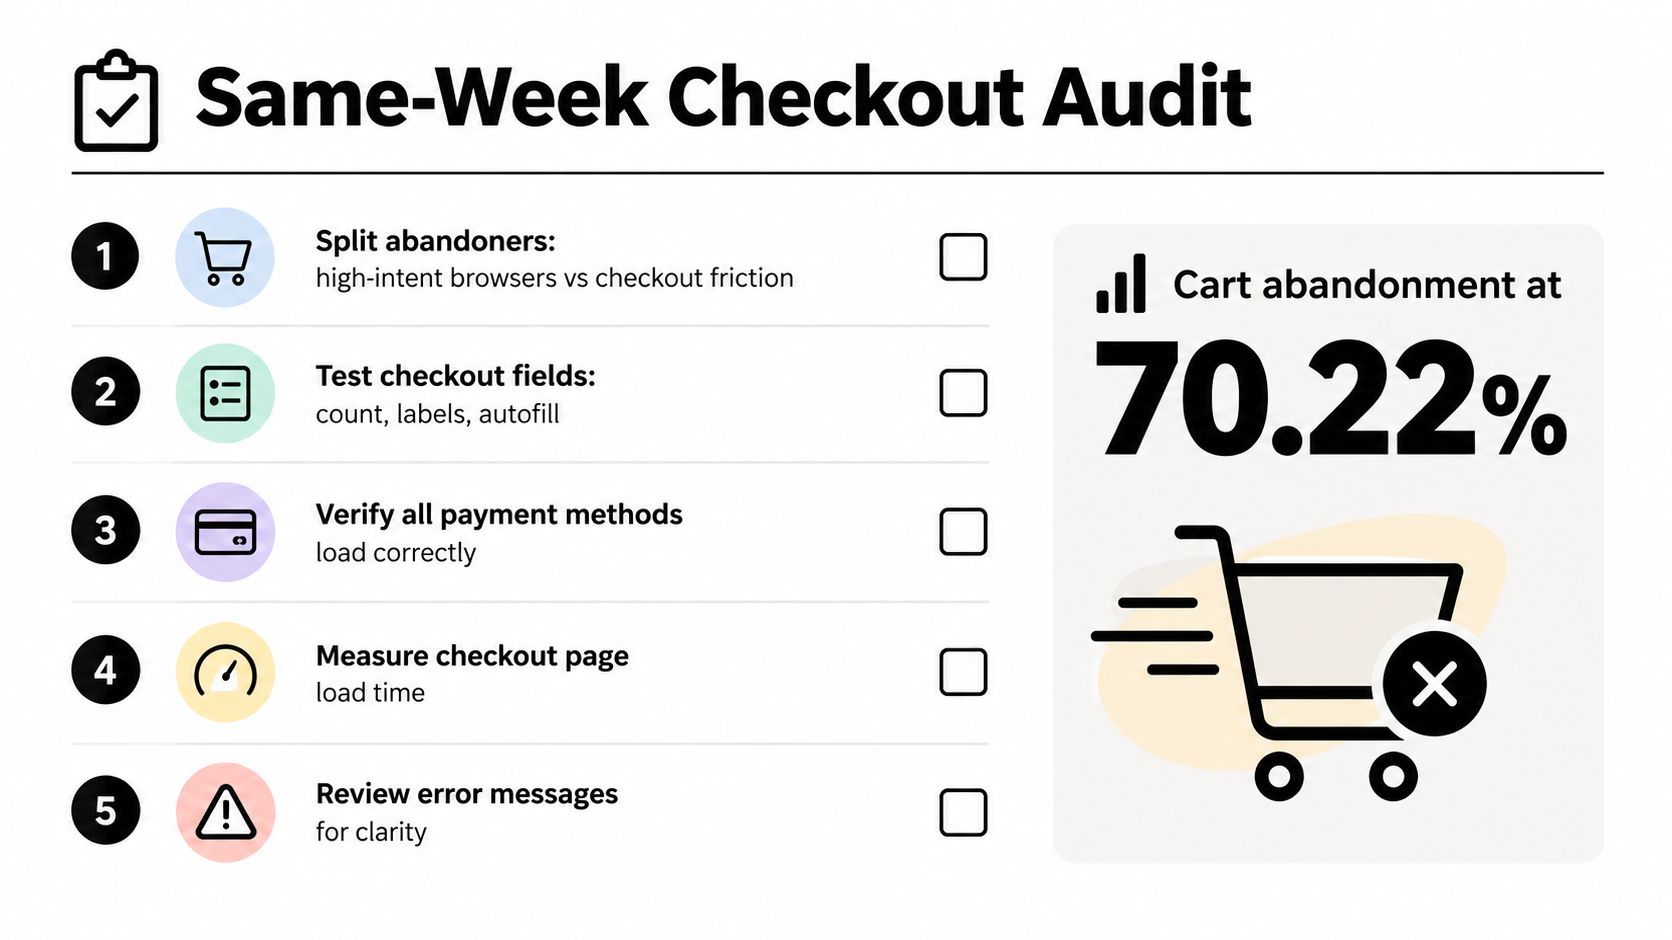
Start with intent segmentation. Some shoppers are still comparing options, saving a cart, or checking details before they commit. Others have already decided to buy and leave because the final steps add friction, doubt, or surprise. Those are different problems, so they need different fixes. Retention flows and reminders can recover the first group. The second group needs a cleaner path to payment.
Map each documented cause to a test
The same research reports that 48% of surveyed shoppers abandoned because extra costs were too high, 24% because account creation was required, 22% because delivery was slow, and 16% because the total order cost wasn't visible before checkout. That gives you a practical audit order. Show estimated shipping, tax, fees, delivery timing, and the full payable total before the payment step. Put guest checkout beside account creation, not behind it.
It also reports that 18% abandoned because they did not trust the site with card information, while 9% cited insufficient payment methods. Audit payment trust where the decision happens, near the card fields, not buried in the footer. Returns, support access, and security reassurance should be visible at the moment of hesitation. Then test whether the payment methods that matter in your market load and complete on real mobile devices, not only in staging.
Research on checkout UX also found that an ideal checkout can contain 12 to 14 form elements, including 7 to 8 actual fields, while the average U.S. checkout contains 23.48 default form elements. Count what you ask for now. Remove optional inputs, enable autofill, collapse address logic where possible, and push account creation until after purchase.
Protect the business from false wins
Track checkout starts, payment completion, and revenue per visitor separately. Add average order value, margin, refund rate, and delivery-related support contacts as guardrails. A lower abandonment rate can still be a bad trade if it brings in low-margin orders or creates service load later.
Run the audit in sequence. Fix cost and delivery transparency first, then guest checkout and field reduction, then payment method and trust gaps. Use this checkout optimization guide to structure the work, but keep every change tied to a specific abandonment reason and a measurable event.
Include form labels, autofill behavior, page speed, error-message clarity, mobile usability, and confirmation tracking in the final pass.
<iframe width="100%" style="aspect-ratio: 16 / 9;" src="https://www.youtube.com/embed/DlQ1wcHFxBo" frameborder="0" allow="autoplay; encrypted-media" allowfullscreen></iframe>Measuring Rigorously When Attribution Is Incomplete
Perfect user-level attribution is no longer a safe default. Privacy restrictions strip signals, buyers research in private spaces, and AI assistants can influence vendor discovery without leaving a clean referral path. Industry guidance from 2025 recommends combining market mix modeling, multi-touch attribution, probabilistic modeling, and synthetic or proxy data to address signal loss, as outlined in its State of Data guidance.
Recent B2B buyer-journey research found that around 60% of respondents use AI assistants to augment vendor lists, summarize content, or surface competitors. That means AI-mediated discovery deserves measurement attention even when the resulting visit shows up as direct traffic or never appears in standard analytics at all.
Replace attribution certainty with triangulation
A defensible measurement system combines several imperfect views:
- Incrementality tests: Hold out a comparable audience where practical to estimate causal impact.
- Geo-holdouts: Compare exposed and unexposed regions when user-level testing isn't reliable.
- Cohort retention: Check whether acquired users continue to create value rather than stopping at conversion.
- Branded-demand trends: Monitor changes in branded discovery as a directional signal of preference.
- CRM revenue: Use closed commercial records as the financial anchor.
- Buyer interviews: Ask what influenced the shortlist, what content was shared privately, and which sources shaped confidence.
Each method answers a different question. A reporting model describes patterns across observed journeys. An incrementality test estimates causal impact. An interview fills gaps that no dashboard can observe. Confusing these outputs creates false confidence.
AI-era discoverability needs its own qualitative and quantitative layer. Record whether target buyers mention the company in AI-assisted research, audit whether important product facts are easy for answer systems to retrieve, and compare AI-sourced awareness with branded search, direct traffic, and target-account engagement. The measurement should remain directional unless a controlled design supports a stronger conclusion.
Install a 90-day operating rhythm
A practical cadence keeps the program from returning to "optimize everything" paralysis:
- Weekly: Hold a 30-minute funnel review against the event map. Confirm the largest qualified-user loss, inspect segment differences, and assign one next experiment.
- Monthly: Re-score the backlog using bottleneck severity, impact, confidence, effort, and guardrails. Retire ideas that no longer address the active constraint.
- Quarterly: Run the pre-contact preference scorecard with target buyers, sales, and customer-facing teams. Compare shortlist inclusion with branded demand, target-account engagement, pipeline, and win rate.
- Recurring: Run an incrementality or geo-holdout test when the decision has meaningful budget consequences. Record uncertainty beside every attribution conclusion.
Sprints & Sneakers provides full-funnel growth work that connects acquisition, activation, revenue, retention, analytics, and AI-supported experimentation. Its marketing attribution approach fits teams that need to separate reporting models from causal decision-making.
The one meeting that prevents drift is a bottleneck review attended by marketing, sales, product or commerce, customer success, and analytics. Its single artifact should be a one-page funnel diagnostic showing the current bottleneck, evidence, hypothesis, primary metric, guardrail, owner, and decision date. Three guardrails protect the program from false wins: never optimize a proxy without a downstream check, never treat an attribution model as causal proof, and never declare success before the defined event and guardrail have both been reviewed.
A funnel compounds when the team ships, measures, and reprioritizes. It doesn't compound when every channel receives another dashboard.
Sprints & Sneakers helps B2B and B2C teams identify the bottleneck limiting funnel performance, build the measurement system around it, and run focused experiments across acquisition, activation, revenue, retention, and referral. Visit Sprints & Sneakers to start with a growth scan and turn the next funnel review into a concrete revenue experiment.
Related articles

Frequently asked questions
Growth marketing, AI and automation, SEO, performance marketing, retention strategies, and sustainable business practices.
Weekly. Subscribe to our newsletter to get new articles straight to your inbox.
Absolutely. Everything we publish is designed to be actionable. Take it, test it, and make it your own.
Yes. We publish experiments with real numbers. What worked, what didn't, and what we learned.
Our growth team — strategists, performance marketers, data specialists, and AI builders who work on client campaigns every day.
We're open to it. Reach out via our contact page with your topic and we'll take a look.