
Compound Growth Marketing: How Small Gains Stack Up
Compound growth marketing explained: how retention, referrals and experiments stack up, plus a diagnosis framework and a roadmap to start this week.
Your weekly report is green. Paid search filled the form queue, the landing page converted, and the channel owner wants more budget. Then finance asks which of those leads are still customers six months later, and the room goes quiet. The CRM holds one version of the account, the ad platform holds another, and the product tool holds a third. Nobody can name which change caused the lift, so the next meeting funds the channel that produced the most clicks.
That's the gap compound growth marketing is built to close. A small gain only stacks when you can prove it survived a long sales cycle and showed up again in the next cohort. What follows is a working system for that proof: connected loops, retention math, a funnel audit, referral counts, a scoreboard, and a 90-day test plan you can start on Monday.
Table of Contents
- What Compound Growth Marketing Means in Plain Terms
- How Retention Turns Small Gains Into Large Returns
- Find the Bottleneck Across Your Funnel
- Build Referral and Repeat Loops That Feed Themselves
- Prioritize Experiments and Track KPIs That Prove Compounding
- Use AI to Speed Up Every Loop Without Losing Judgment
- Run the First 90 Days of Compounding Experiments
- Avoid Six Mistakes and Test One Bottleneck This Month
What Compound Growth Marketing Means in Plain Terms
A snowball doesn't get big from one shove. It grows because each turn keeps the snow the last turn packed on. Stop the roll and the mass sits there until it melts. Campaigns work the same way. A spike dies the day spend stops. A loop keeps what the last cycle built.
Compound growth marketing is a set of connected loops in which every gain in acquisition, activation, retention, or referral makes the next cycle cheaper and larger.
A B2B pipeline and a B2C shop can't share one model. Growth marketing is run as separate B2B and B2C funnels, because a different business needs a different funnel. A SaaS sale may take a quarter and expand through renewals. A webshop can close in a session and compound through reorder. Same idea, different clocks.
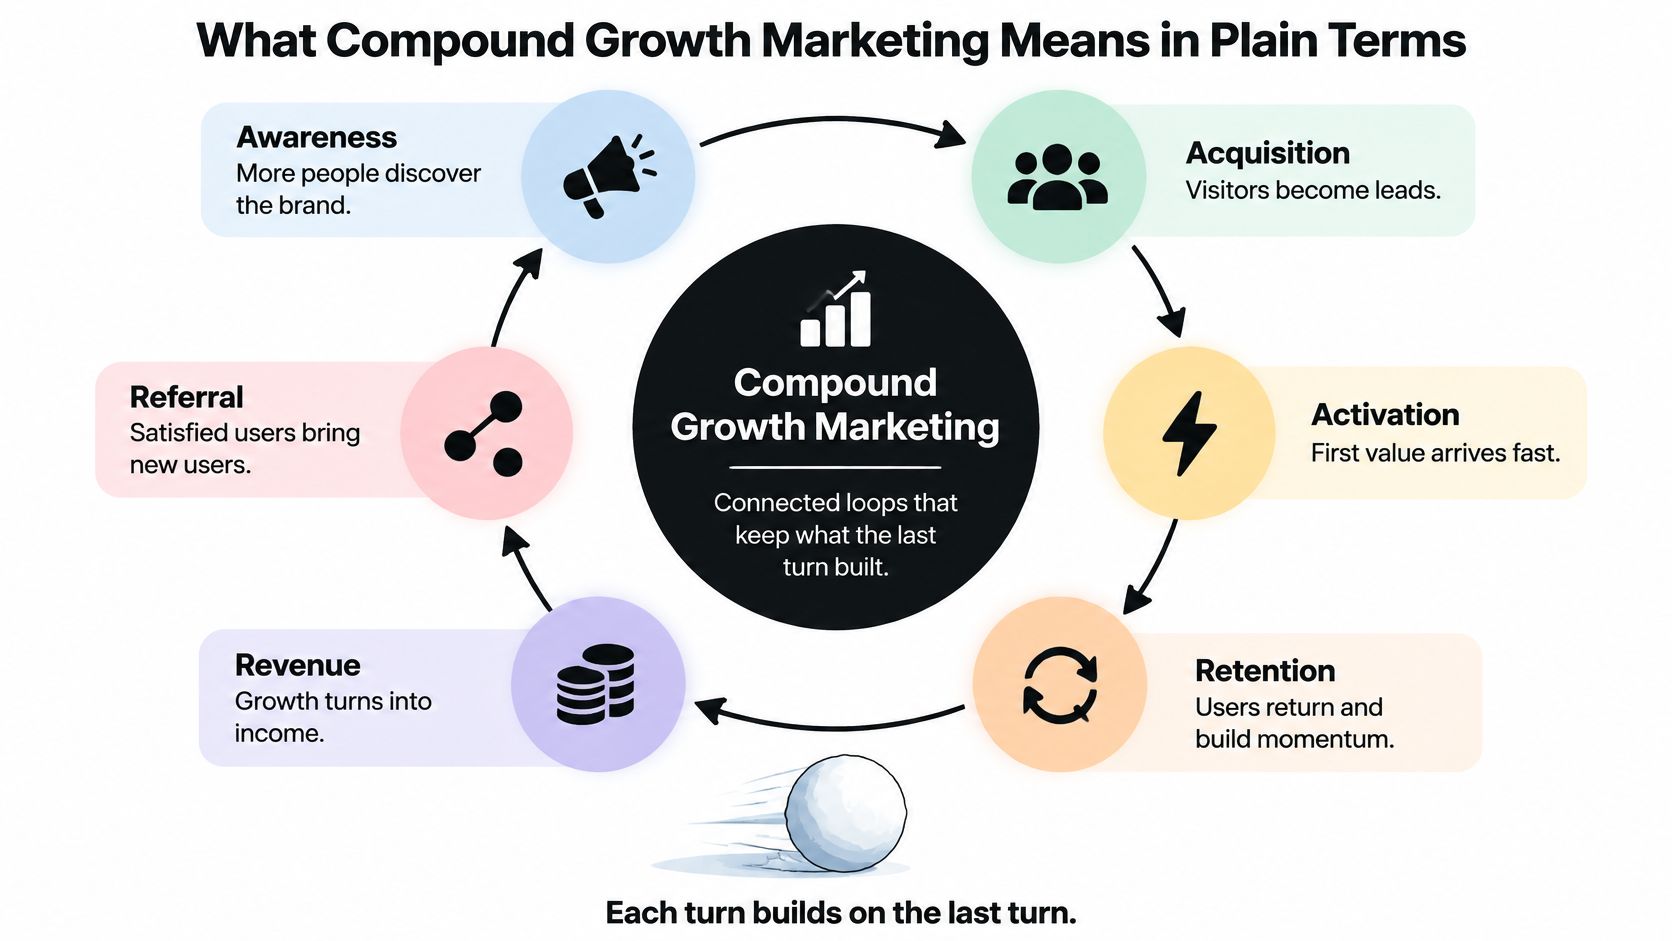
Say four levers each improve by 10%. Acquisition adds buyers once. Retention and referral keep paying inside every later cohort.
| Lever improved by 10% | One-time effect | Compounding effect |
|---|---|---|
| Acquisition | 10% more customers, once | Only the new cohort grows |
| Activation | More signups reach the value moment | Every later cohort starts with more active users |
| Retention | Customers stay longer, once | Each later cohort keeps more revenue |
| Referral share | 10% more referred buyers, once | Referred buyers refer others and lower future acquisition cost |
History shows the loops can move together. In its 1997 shareholder letter, Amazon reported sales rising from $15.7 million in 1996 to $147.8 million in 1997, while the share of orders from repeat customers climbed from more than 46% in the fourth quarter of 1996 to more than 58% a year later. Treat that as a reference point from early expansion, not a benchmark anyone should copy.
Answer three questions about your own book today. Which cohort still buys after six months? Which customers refer someone new? How many months does a new customer take to repay its acquisition cost?
How Retention Turns Small Gains Into Large Returns
A Bain & Company analysis reports that, at MBNA, a 5% increase in customer retention increased profits by 60% by the fifth year. Read that as a case benchmark, not a forecast for your P&L. The shape of the result is what matters. A kept customer changes four economics at once.
- Re-engagement is cheaper. The person already knows the brand, so you don't pay a full acquisition cost to get another order or renewal.
- The product is already understood. Support time drops, and the next offer doesn't have to reteach the basics.
- Spend expands. Repeat purchase, a higher plan, or a cross-sell lands on an account that already cleared the trust hurdle.
- A referral can follow. One kept customer sometimes brings the next one, which lowers the cost of the cohort after that.
A twelve-month cohort you can rebuild
Take a subscription book of 1,000 customers, acquired at the same cost. Cohort A churns 5% a month. Cohort B churns 3% a month. After twelve months, about 540 customers remain in A and about 694 in B. That's roughly 28% more active customers from the same acquisition spend, before any price increase. In a spreadsheet, start at 1,000 and multiply by 0.95 or 0.97 twelve times. The gap is the case for fixing churn before buying more leads.
Model it at cohort level, not as a company average. Track logo retention, revenue retention, gross margin by cohort, expansion revenue, time-to-value, and referral rate. Then forecast contribution profit on the current retention curve and on an improved curve. The gap between those two forecasts tells you which post-purchase test deserves the next sprint. For consumer brands, a retention guide for DTC brands walks through the same idea on repeat purchase rather than renewals.
The B2B version is renewals
A services firm with 300 accounts renewing at 85% a year keeps 255. Lift renewals to 88% and about nine more accounts stay, before any expansion revenue. Each kept account skips a full re-acquisition cycle. Replace these figures with your own renewal file before you brief the team. The same logic sits behind a practical set of customer retention metrics: if the curve doesn't move, the campaign didn't compound.
Find the Bottleneck Across Your Funnel
A growth system only moves as fast as its narrowest stage. Launching a new channel while that stage is stuck just piles more people into the same jam.
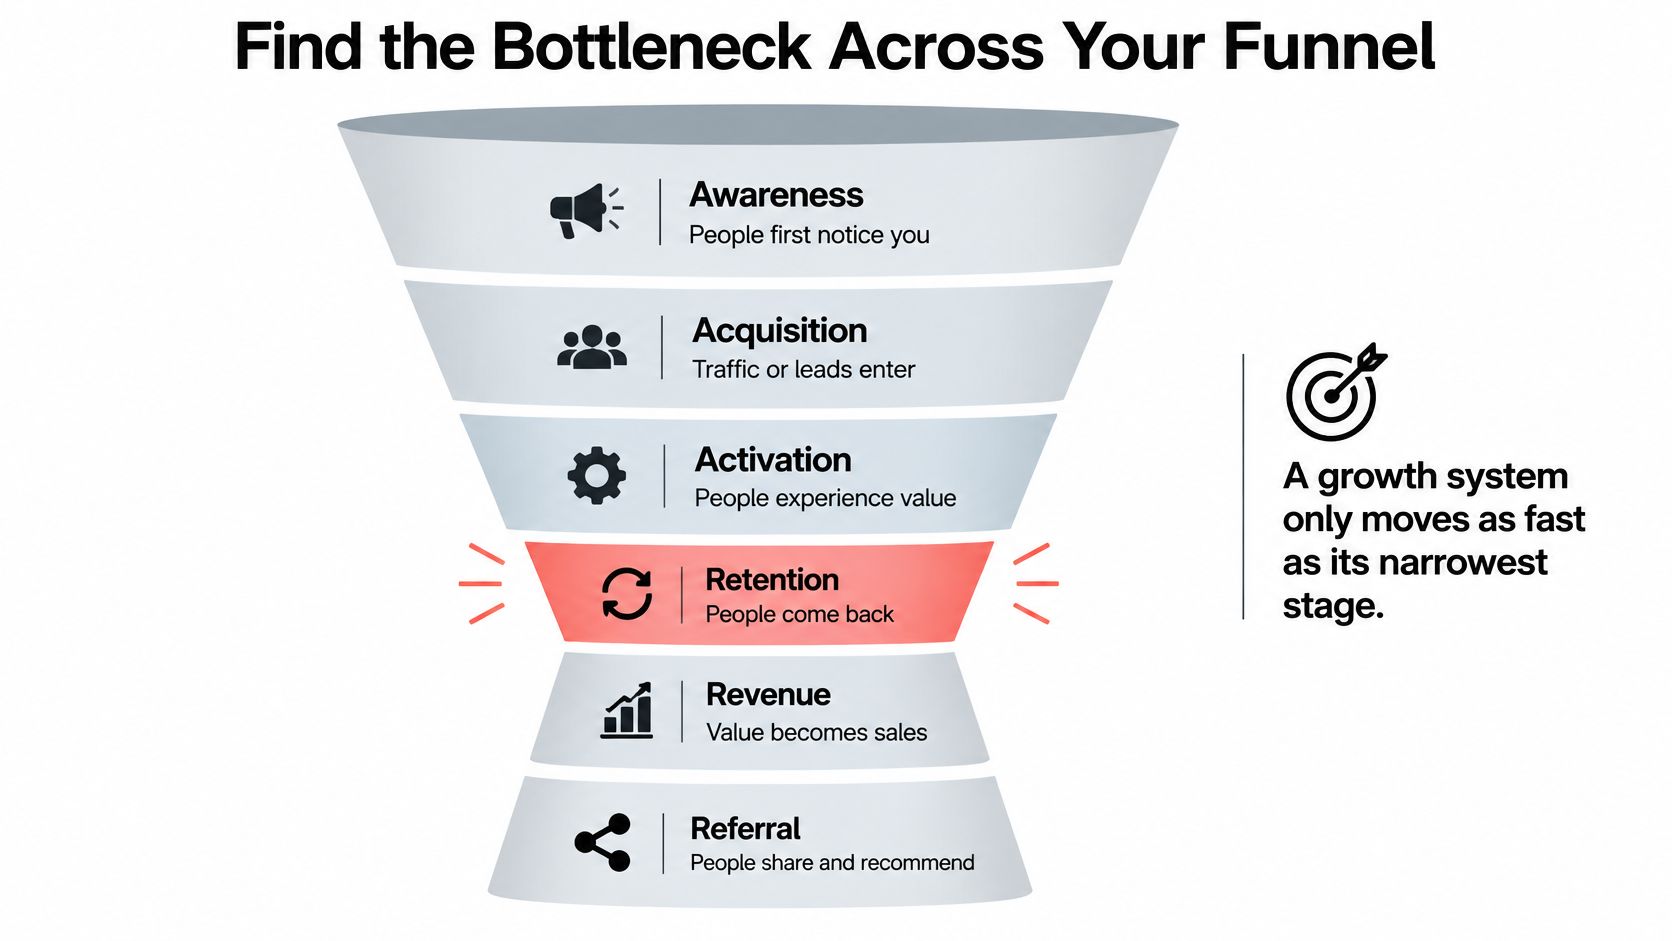
Each stage answers one question.
- Awareness: Do the right people notice you without a paid prompt?
- Acquisition: Do visits become qualified leads, not just form fills?
- Activation: Do new users reach a real result quickly?
- Revenue: Does value turn into a sale at a steady pace?
- Retention: Do people come back after the second month?
- Referral: Do satisfied users bring someone who also stays?
| Funnel stage | Healthy signal | Warning sign |
|---|---|---|
| Awareness | Branded search and direct visits rising | Traffic grows while branded demand stays flat |
| Acquisition | Cost per qualified lead stable | Cost per form fill falls but qualified leads do not grow |
| Activation | Users reach the value event within 7 days | Signups stall before the first key action |
| Revenue | Conversion steady across cohorts | Sales cycle lengthens each quarter |
| Retention | Cohort revenue retention above 100% | Churn spikes after the second month |
| Referral | Referred customers' share of new sign-ups rising | Invitations sent but few referred customers retained |
A next-day audit in six steps
GA4 Funnel Exploration supports up to 10 steps, each based on events or shared dimension values. You don't need custom software.
- Define the path. For a shop, use product view, add to cart, checkout start, and purchase. For B2B, swap in demo request, sales-accepted lead, and closed-won.
- Pick closed or open. A closed funnel requires every user to start at step one. An open funnel lets people enter later, which matches buyers who skip the homepage.
- Set a time limit. A step can be required immediately, or allowed after other actions, inside a window you choose.
- Find the largest step-to-step drop. An overall conversion rate hides where people leave. The biggest drop is the bottleneck.
- Split the same funnel by first-touch channel, device, or campaign.
- Choose the segment with meaningful traffic and unusually weak progression. A tiny audience with a bad rate isn't the priority.
Step 2 of a serious growth process is to decide where the business wants to grow, focusing on the keywords and pages with the biggest impact on traffic and revenue rather than tackling everything at once. A wider look at conversion funnel optimization helps once that page is named.
One-bottleneck rule: For the next 90 days, fix one stage, and write down why it was chosen. A second test starts only after that stage moves.
Build Referral and Repeat Loops That Feed Themselves
The invitation lands when the customer has already received value. Put it directly after a successful activation, a completed service result, or a delivered order. Sent at signup, that ask behaves like a campaign with an end date. Sent after the result, it runs as a cycle.
Trust comes from the person doing the asking. Nielsen's global online survey of 30,000 internet users across 60 countries found that 83% of respondents had complete or considerable confidence in information from acquaintances or family, and recommendations from those people drew the same 83% average trust.
Where referral programs break is measurement. A click proves an invitation moved. It says nothing about whether the referred customer stayed. Across a long sales cycle the invite, the first order, and the second order sit in different systems, so nobody can show which invitation caused the revenue. Build the loop so each stage stays visible on its own.
Four counts, not one vanity number
- Give every customer a unique referral code at the value moment, not in a generic footer.
- Report four stages separately: invitation sent, referral visit, first conversion, and retained customer.
- Calculate retained-customer yield as retained referred customers divided by invitations sent.
- Compare that yield by source and by cohort. A channel that sends many invites and keeps few people adds cost without creating a loop.
If you want patterns for the offer itself, referral campaign inspiration from that blog shows how other programs time the ask and the reward. Keep the reward simple enough that finance can model it against the yield above, and check whether the reward eats the margin on the second order before you widen the discount. A fuller referral marketing strategy only pays off once those four numbers exist.
The repeat loop beside it
Referral isn't the only cycle that feeds itself, and a repeat loop is usually cheaper to prove because the data sits in one system.
- After the second purchase, send a lifecycle note that assumes the product is in use, not a welcome email recycled with a new subject line.
- Once the first result is delivered, ask for a review. Waiting until month six means you ask people who already forgot the win.
- Time a reorder reminder to typical usage. A consumable that lasts 30 days should not get a "we miss you" note on day 90.
The map in plain language is short. Content brings a visitor. Activation turns the visitor into a user. The user refers a friend. The friend starts the next cycle. One missing arrow and the spend on the others still leaks.
Prioritize Experiments and Track KPIs That Prove Compounding
A compounding KPI asks whether today's gain still works next quarter. Channel totals can't answer that. Cohort numbers can.
| KPI | How to calculate | What it tells you |
|---|---|---|
| CAC payback | Acquisition cost divided by monthly gross margin per customer | Months until a customer repays what it cost to win them |
| LTV to CAC ratio | Lifetime gross margin divided by acquisition cost | Above 3 to 1 is a common benchmark for scaling spend |
| Net revenue retention | Current revenue from a cohort divided by its starting revenue | Above 100% means existing customers grow on their own |
| Referral yield | Retained referred customers divided by invitations sent | Quality of the referral loop, not its volume |
| Activation rate | Users reaching the value event divided by sign-ups | Whether acquisition turns into real use |
| Cost per qualified lead | Spend divided by sales-accepted leads | The true cost of pipeline, not form fills |
Score the backlog before you spend
Give each experiment a score from 1 to 5 on four things: economic impact, confidence in the result, learning value, and effort. Then add a compounding check. Does the gain carry into retention or referral, or does it die at the click? Clicks, form fills, and assisted conversions alone don't justify a scale-up. They justify a closer look.
Lead definitions drift the same way. Norwest's 2024 B2B Sales & Marketing Benchmark Report, based on 195 sales and marketing leaders, found that in 2024 only 38% of B2B companies surveyed used lead scoring to define marketing-qualified leads, down from more than half in 2023. Rebuild scoring from closed revenue, not from last year's habit. A form fill that sales never accepts shouldn't move the cost line.
Scale an experiment only when the holdout comparison is clear, the sample is large enough to trust, and the downstream metric moves in the same direction as the front-end metric.
Set the minimum sample before launch, from your baseline rate and the smallest lift worth acting on. When revenue is sparse or late, rank tests with leading signals such as qualified leads. Scale only after the downstream metric confirms the gain. A clean write-up of A/B testing for marketing is useful here, as long as the winner is judged on payback or retained revenue, not on the click.
Use AI to Speed Up Every Loop Without Losing Judgment
Teams adopted the tools faster than they learned to prove them. Jasper's 2026 state of AI in marketing reports that 91% of surveyed marketers used AI in 2026, up from 63% in 2025, while the share able to prove AI's ROI fell from 49% to 41%. More automation didn't produce better growth intelligence. It produced more activity with a weaker claim on cause.

The workable setup is a hybrid. Growth marketers are paired with AI agents for research, reporting, and execution. A person owns the hypothesis and the go or no-go. The agent drafts. The analyst checks. Nobody lets a dashboard declare causation across a six-month sales cycle and three identity systems.
Five jobs worth handing over
- Query and competitor research. Group hundreds of search queries by intent in an afternoon, then have a strategist delete the clusters that don't match a real buyer job.
- Weekly funnel drafts. An agent writes the first pass of the step-to-step report. An analyst confirms the segments before it reaches the Monday meeting.
- Behavior-based lifecycle notes. A user stalled on setup for two days gets a specific reminder, not a generic nurture drip.
- Creative variants for a live test. Generate the options, then review each one for brand fit before any spend. Real-world marketing examples from RedactAI show where teams draw that line between draft and publish.
- Anomaly alerts. When a funnel step falls outside its normal range, check the release log before you blame the channel. A bad deploy looks a lot like a bad ad.
The benefits of AI in marketing show up in speed, not in a free pass on measurement. Judge every AI-driven change on qualified pipeline or retained revenue, and keep a holdout so the automation has to earn the scale-up.
<iframe width="100%" style="aspect-ratio: 16 / 9;" src="https://www.youtube.com/embed/725QE_LNXT4" frameborder="0" allow="autoplay; encrypted-media" allowfullscreen></iframe>Run the First 90 Days of Compounding Experiments
A framework that never hits a calendar is a slide. This one starts Monday, in four phases.
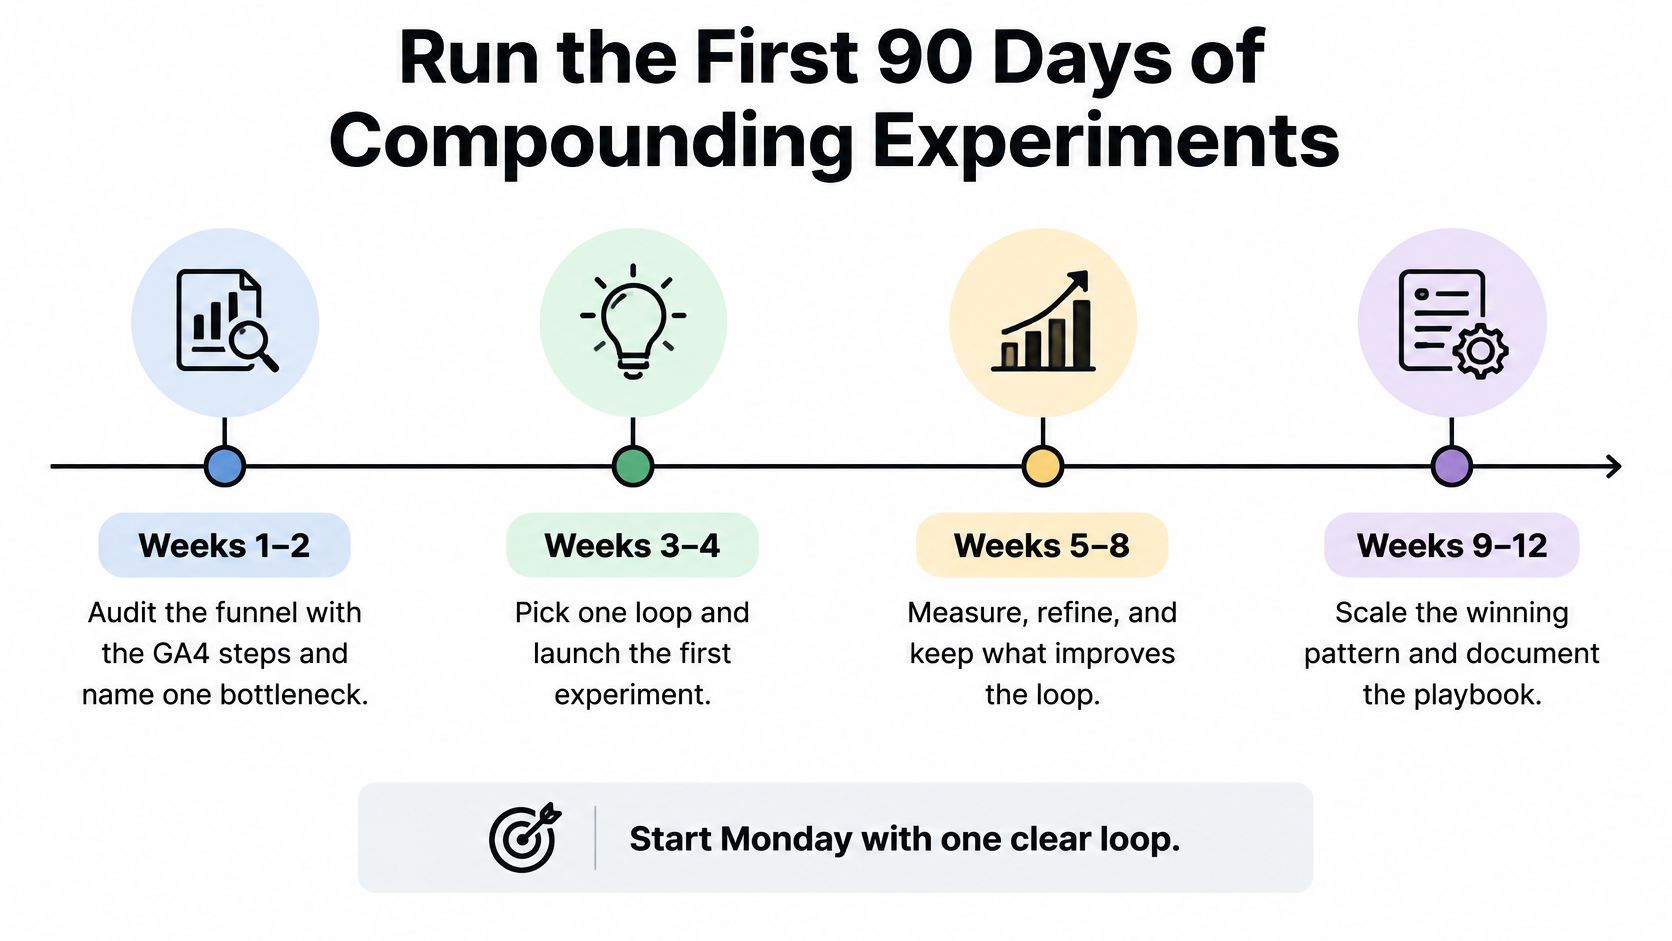
Weeks 1 to 2. Run the funnel audit and name one bottleneck. Write the reason in the experiment log so a later sprint doesn't reopen the argument.
Weeks 3 to 4. Instrument the events, the referral codes, and the cohort model. If the value event isn't tracked, you can't tell activation from traffic.
Weeks 5 to 8. Run three or four experiments, each with a holdout. Three honest tests beat twelve overlapping ones.
Weeks 9 to 12. Write the winners down as growth plays and retire the losers in the same file. Winning experiments are turned into documented growth plays across markets, so a second country doesn't rediscover the same headline.
The first experiment, with a number you can check
Take the highest-traffic landing page. In Search Console, record its Core Web Vitals against Google's thresholds: Largest Contentful Paint at 2.5 seconds or less, Interaction to Next Paint at 200 milliseconds or less, and Cumulative Layout Shift at 0.1 or less. Those thresholds use real-user data, and a URL group's status follows its weakest metric once enough data exists. Fix one likely cause, such as an oversized hero image, then compare lead completion with a control page over the same period. Speed without a conversion read is an SEO task. Speed with a holdout is a growth test.
Who owns what
- Growth lead: the funnel model and the one-bottleneck call.
- Performance marketer: channel spend inside that call.
- Lifecycle owner: retention and reorder flows.
- Analyst: events, cohorts, and the weekly read.
- AI agents: first drafts of research and reports, reviewed by a person.
The tool set stays small: analytics, Search Console, the CRM, a shared experiment log, and a cohort spreadsheet. The habit that makes compounding stick is simple. Every winning test becomes a written play another product line can reuse, including the sample size, the holdout, and the metric that moved.
Avoid Six Mistakes and Test One Bottleneck This Month
Compounding programs usually fail on measurement design. Teams cannot prove which change caused a lift across a long sales cycle, so they scale the loudest number and call it growth. The six common mistakes cluster into three decisions: what counts as a result, which stage gets the next test, and when a result is strong enough to scale.
Use those three decisions as a checklist against the earlier sections. If the funnel model says activation is the constraint, do not buy more acquisition traffic. If referral clicks are rising but retained revenue is flat, the loop is not feeding itself yet. If one dashboard claims causation across fragmented identities, add a holdout or a cohort read before you trust it. Each check sends you back to the funnel, KPI, or referral work you already built.
One test, then the next bottleneck
Pick the stage the audit named. Write a hypothesis that predicts a change in a downstream metric, not in traffic. Set a holdout. Run one test for two to four weeks. Log the result in the experiment file using the same KPI definitions as the scoreboard, so this cycle can be compared with the last one.
After the window, apply the scale rule you set when you designed the scoreboard. If the result does not clear it, stop or rewrite. Then choose the next bottleneck. Do not add a second test while you are in there. One clean read beats three tangled ones, because the log is what lets a win become a play another product line can reuse.
Sprints & Sneakers offers a free growth audit for teams that want that first bottleneck named with an outside read, before another quarter of spend lands on the widest part of the funnel.
The first test is small on purpose. Its job is to prove the loop can be measured, so the next cycle starts with a written play instead of another green weekly report that finance cannot trace.
Sprints & Sneakers runs full-funnel growth for B2B and B2C brands, starting from the single bottleneck that keeps small gains from stacking into retained revenue. If your team can see the clicks but cannot prove which change still pays off next quarter, a structured audit and a sprint plan will show where to test first. Visit Sprints & Sneakers and book a conversation about the loop you want to prove.
Related articles

Frequently asked questions
Growth marketing, AI and automation, SEO, performance marketing, retention strategies, and sustainable business practices.
Weekly. Subscribe to our newsletter to get new articles straight to your inbox.
Absolutely. Everything we publish is designed to be actionable. Take it, test it, and make it your own.
Yes. We publish experiments with real numbers. What worked, what didn't, and what we learned.
Our growth team — strategists, performance marketers, data specialists, and AI builders who work on client campaigns every day.
We're open to it. Reach out via our contact page with your topic and we'll take a look.