
Marketing Efficiency Ratio: How to Calculate and Use It
Learn how to calculate your marketing efficiency ratio, with a worked example, realistic benchmarks and the pitfalls that skew it.
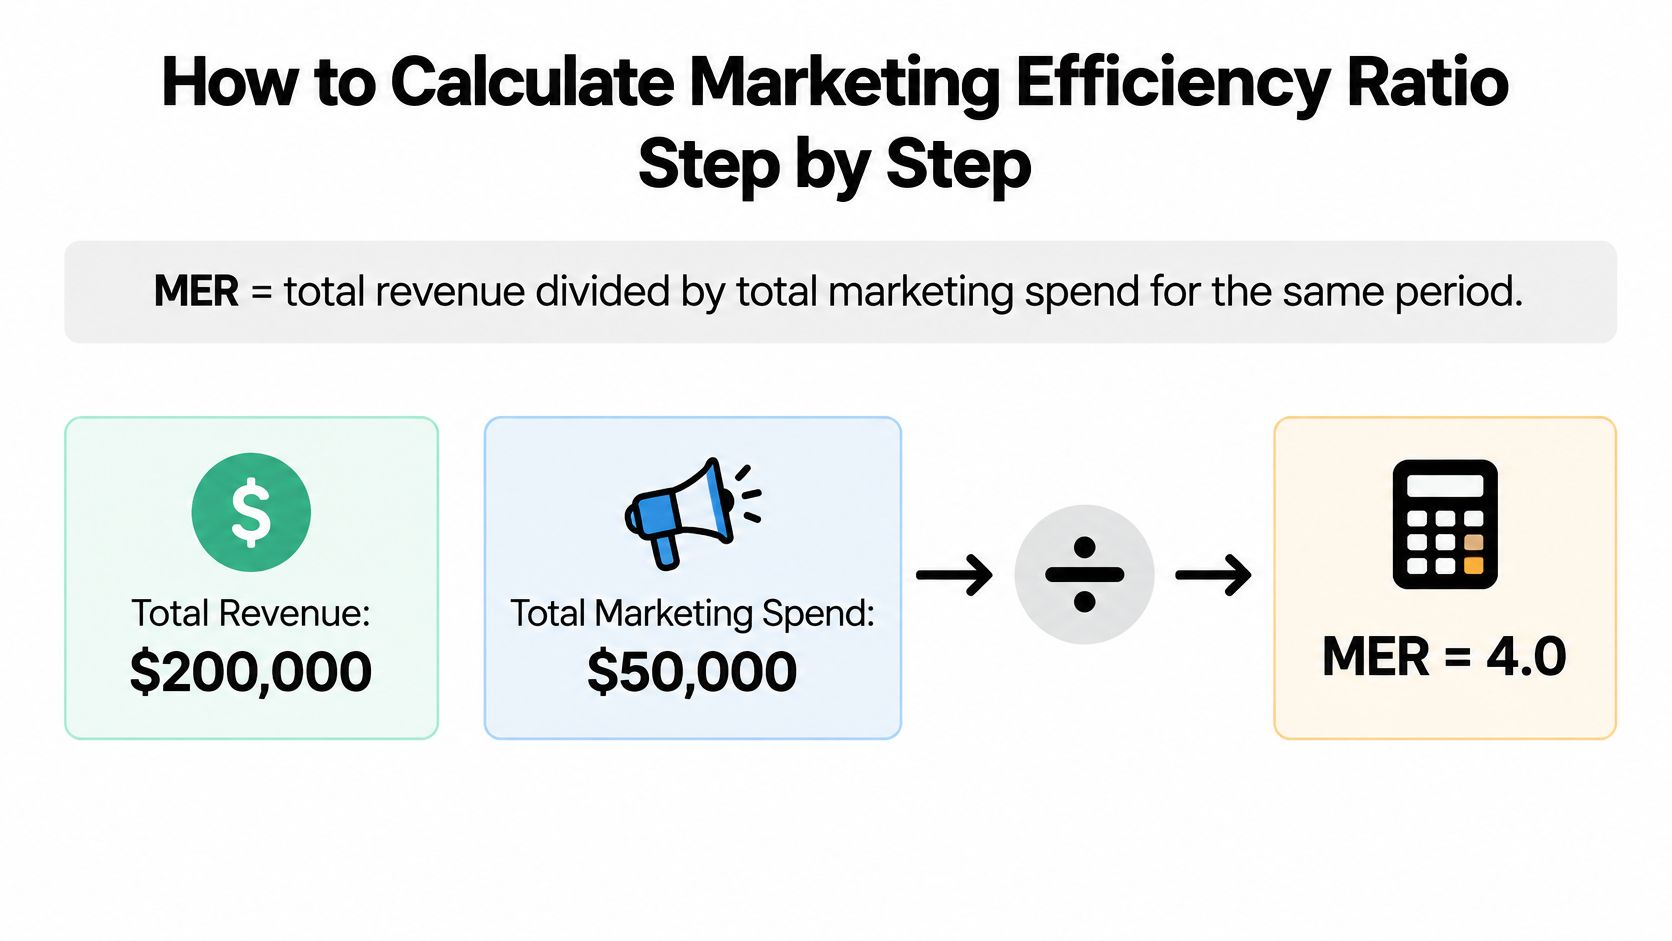
Marketing efficiency ratio (MER) is total revenue divided by total marketing spend for the same period. A business generating $200,000 in revenue while spending $50,000 on marketing has an MER of 4.0.
The campaign dashboards look healthy, but finance is asking why there isn't more cash left. Paid media reports strong returns, sales claims some of the same deals, and nobody agrees on whether agency fees belong in the calculation.
MER gives that conversation a common starting point. Its real value comes from reading it against gross margin and incremental growth, not treating a bigger number as an automatic win.
Table of Contents
- How to Calculate Marketing Efficiency Ratio Step by Step
- Common Calculation Mistakes and How to Fix Them
- MER Compared With ROAS, CAC and LTV
- Break-Even MER and How High Your Ratio Must Be
- Realistic MER Benchmarks by Business Model
- Why a High MER Can Hide Saturation
- Lift MER Across the Funnel, Stage by Stage
- Start Your MER Baseline This Quarter
How to Calculate Marketing Efficiency Ratio Step by Step
MER = total revenue ÷ total marketing spend for the same period. The TapClicks guide to marketing efficiency ratio illustrates this with $200,000 in revenue divided by $50,000 in marketing spend, producing an MER of 4.0, meaning each $1 of marketing investment corresponds to $4 in revenue.
The word corresponds matters. MER describes the relationship between revenue and spending; it doesn't prove that marketing caused every sale.
Build a calculation that finance can repeat
-
Fix the reporting window. Choose a month or quarter and use matching dates for revenue and costs. A quarter can make more sense when campaigns support purchases that take time to close.
-
Add revenue from that window. Decide whether the calculation uses gross revenue or net revenue after refunds and discounts. Net revenue usually offers a cleaner operating view, but consistency matters more than changing definitions.
-
Add all relevant marketing spend. Include paid media, agency fees, tools, creative production and the marketing team's cost. Allocate shared costs using a documented rule rather than whichever treatment makes the result look better.
-
Divide revenue by spend. Report the result as a multiple, not a percentage. Keep the underlying revenue and cost totals beside it so another person can check the arithmetic.
-
Compare equivalent periods. Calculate the same measure for the previous quarter or the corresponding period last year. Seasonal businesses need both comparisons to separate a marketing change from a familiar buying pattern.
MER is blended and attribution-free. Paid, organic, referral and sales-assisted revenue sit together in the numerator rather than being assigned to competing platform claims.
That makes the ratio useful for leadership discussions about the whole marketing system. It also means an organic sale isn't free by definition: content production, partnership management and the people supporting those activities still cost money.
Make the number operational
A membership business, for example, should reconcile membership revenue with campaign costs rather than stop at lead volume. Gym Membership Tips' guide to turn gym marketing spend into profit provides a useful companion for connecting the spending discussion to commercial outcomes.
Practical rule: A repeatable MER with a written definition is more useful than a flattering MER nobody can reproduce.
The immediate task is small: calculate last quarter's MER and record the result, reporting window and included spend categories on a single line. Attach the revenue export and cost ledger so the next calculation starts from the same evidence.
Common Calculation Mistakes and How to Fix Them
MER jumps one month and drops the next, yet the business hasn't changed much. Before changing the campaign plan, the analyst should check whether reporting dates, refund treatment or cost inclusion changed between periods.
MER symptoms, causes and fixes
| Symptom | Likely cause | Fix |
|---|---|---|
| MER jumps one month, then drops | Reporting window or refund treatment changed between periods | Lock the window and revenue definition for every period |
| MER looks healthy while profit falls | Gross revenue used while margins shrank | Publish gross-profit MER beside revenue MER |
| Two teams report different MER | Finance uses net revenue, marketing uses gross | Agree one measurement contract across finance, CRM and analytics |
| MER looks too high | Partner, referral or sales spend left out of the denominator | Add all relevant spend, including sales support and partner fees |
| SaaS MER rewards bookings | Bookings counted before renewals, churn and expansion | Add new-customer MER and a full-funnel MER that includes renewals |
Set boundaries on the denominator so spend enters it deliberately. Sales development and customer success costs belong in the agreed full-funnel view where relevant, with allocations documented so nothing is counted twice.
SaaS requires particular care. Booked contracts, recognized revenue, implementation costs and renewals arrive on different timelines, so a strong booking period can coexist with weak retention.
Start with a tracking and attribution audit
The audit should list what the business measures, what it misses and where teams use conflicting definitions. Sprints & Sneakers includes this work in its Spot the bottlenecks step and sets up tracking so every euro spent can be linked to the revenue it generates.
Linking spend to revenue supports reconciliation between systems. It cannot prove a customer would not have purchased anyway, which is why MER stays a blended measure and why the incrementality questions belong to the saturation discussion later in this guide.
Nielsen reports that 42% of global marketers recognize the impact of changing privacy rules and the move toward a cookieless web, as discussed in HubSpot's MER guide. The practical response: keep first-party revenue records as the source of truth, and run a holdout or geo-split test when a channel's reported revenue looks too clean. Where direct observation falls short, modeled measurement fills the gap.
Agree a measurement contract
Finance, CRM, advertising and analytics teams should share a written contract covering:
- Revenue rules: Recognition dates, refunds, discounts, renewals and expansion.
- Cost rules: Included departments, shared-cost allocations and invoice timing.
- Decision rules: Which view informs budget allocation, acquisition scaling or retention experiments.
Publish revenue MER beside a gross-profit view, then add new-customer and full-funnel views when they answer a specific operating question. Labels must make the numerator and denominator obvious.
Every team should divide the same revenue by the same spend when discussing the same metric. If finance and marketing produce different figures, trace the contract line by line until one line item explains the gap.
MER Compared With ROAS, CAC and LTV
| Metric | Formula | Scope | Question it answers |
|---|---|---|---|
| Marketing efficiency ratio (MER) | Total revenue / total marketing spend | Whole marketing system, blended | Is the entire marketing budget paying off? |
| Return on ad spend (ROAS) | Platform-attributed revenue / platform ad spend | One channel or campaign | Is this campaign returning its ad spend? |
| Customer acquisition cost (CAC) | Total acquisition spend / new customers | Cost per new customer | What does it cost to win one customer? |
| Customer lifetime value (LTV) | Revenue or gross profit per customer over their lifetime | One customer over time | How much is a customer worth over time? |
| LTV to CAC ratio | LTV / CAC | Unit economics | Does acquisition pay back over the customer's life? |
ROAS is a receipt from a particular counter; MER is the whole shop's takings relative to its marketing costs. Neither replaces the customer economics behind those sales.
Trust MER for the budget-level view, but set it aside when diagnosing an individual campaign. A blended result can't identify which audience, offer or creative needs attention.
Trust ROAS for channel tuning when attribution settings remain consistent. The guide to return on ad spend helps frame that narrower calculation, but platform-reported revenue shouldn't become the company's financial record.
Read disagreements as clues
Suppose a consumer brand reports healthy social advertising ROAS while overall MER falls. The platform may be claiming demand the business isn't gaining, although rising non-media costs, delayed purchases or weaker organic sales are also possible explanations.
The right response is reconciliation, not an immediate budget cut. Check total revenue, marketing costs, customer mix and attribution settings before choosing the next test.
- CAC needs a stable customer definition. A new account, first purchase and newly paying customer aren't interchangeable. Acquisition costs must match the group being counted.
- LTV needs an explicit horizon. A forecast built from young customer cohorts is less dependable than observed repeat purchasing. Revenue-based LTV also shouldn't be mistaken for available profit.
- LTV:CAC needs comparable inputs. Comparing lifetime revenue with acquisition cost can look attractive while ignoring the cost of delivering the product or service.
Use MER to judge the whole budget, ROAS to tune channels, and CAC with LTV to judge customer economics.
A final check is payback timing. Acquisition can look attractive over a customer's lifetime while creating a cash problem today, especially when sales cycles are long or renewals arrive well after the initial marketing bill.
Break-Even MER and How High Your Ratio Must Be
Break-even MER is approximately the reciprocal of gross margin. It answers a narrow question: how much revenue each marketing euro must support so gross profit covers the spend.
Before using the floor, confirm whether finance counts shipping and fulfilment inside gross margin. Costs left outside that margin still have to be paid, so a clean-looking ratio can clear one definition and miss the correct one.
Break-even MER by gross margin
| Gross margin | Break-even MER | MER needed to keep 10% of revenue |
|---|---|---|
| 40% | 2.5 | 3.33 |
| 50% | 2.0 | 2.5 |
| 60% | 1.67 | 2.0 |
| 70% | 1.43 | 1.67 |
| 80% | 1.25 | 1.43 |
These are calculated scenarios, rounded where necessary. The last column shows the revenue multiple needed to retain the stated share after marketing, before overhead and other business costs.
Move from a floor to an operating target
Take a brand with a 60% gross margin that wants to keep 10% of revenue after marketing. Its target MER is 1 ÷ (0.60 − 0.10) = 2.0.
I read that 2.0 as coverage under the chosen margin definition, not proof of profit; the retained 10% still carries overhead, tax and any costs the margin excluded.
- Pull gross margin from the latest quarterly finance report. Use realized margin rather than a product-page estimate.
- Calculate the marketing break-even floor. Divide unity by the margin expressed as a decimal.
- Reserve the required contribution. Subtract the share of revenue that must remain after marketing, then recalculate.
- Weight mixed margins by revenue. If low-margin products carry more of total sales, the floor rises; if high-margin repeat revenue dominates, it falls. A simple product average can hide that shift.
Allow for customer and product mix
Repeat customers may support different acquisition decisions from first-time buyers. Class A Media's resource on reading CLV cohorts for retention offers a useful way to examine that distinction without assuming every customer behaves alike.
The broader question of whether e-commerce is still profitable likewise requires more than a revenue multiple.
Above break-even means marketing is covered under the chosen cost definition. It doesn't establish that demand is incremental or that the business is profitable. A multiple over the floor can still mask saturation; a multiple near it can be rational during an acquisition push if payback, margin mix and overhead are understood.
Realistic MER Benchmarks by Business Model
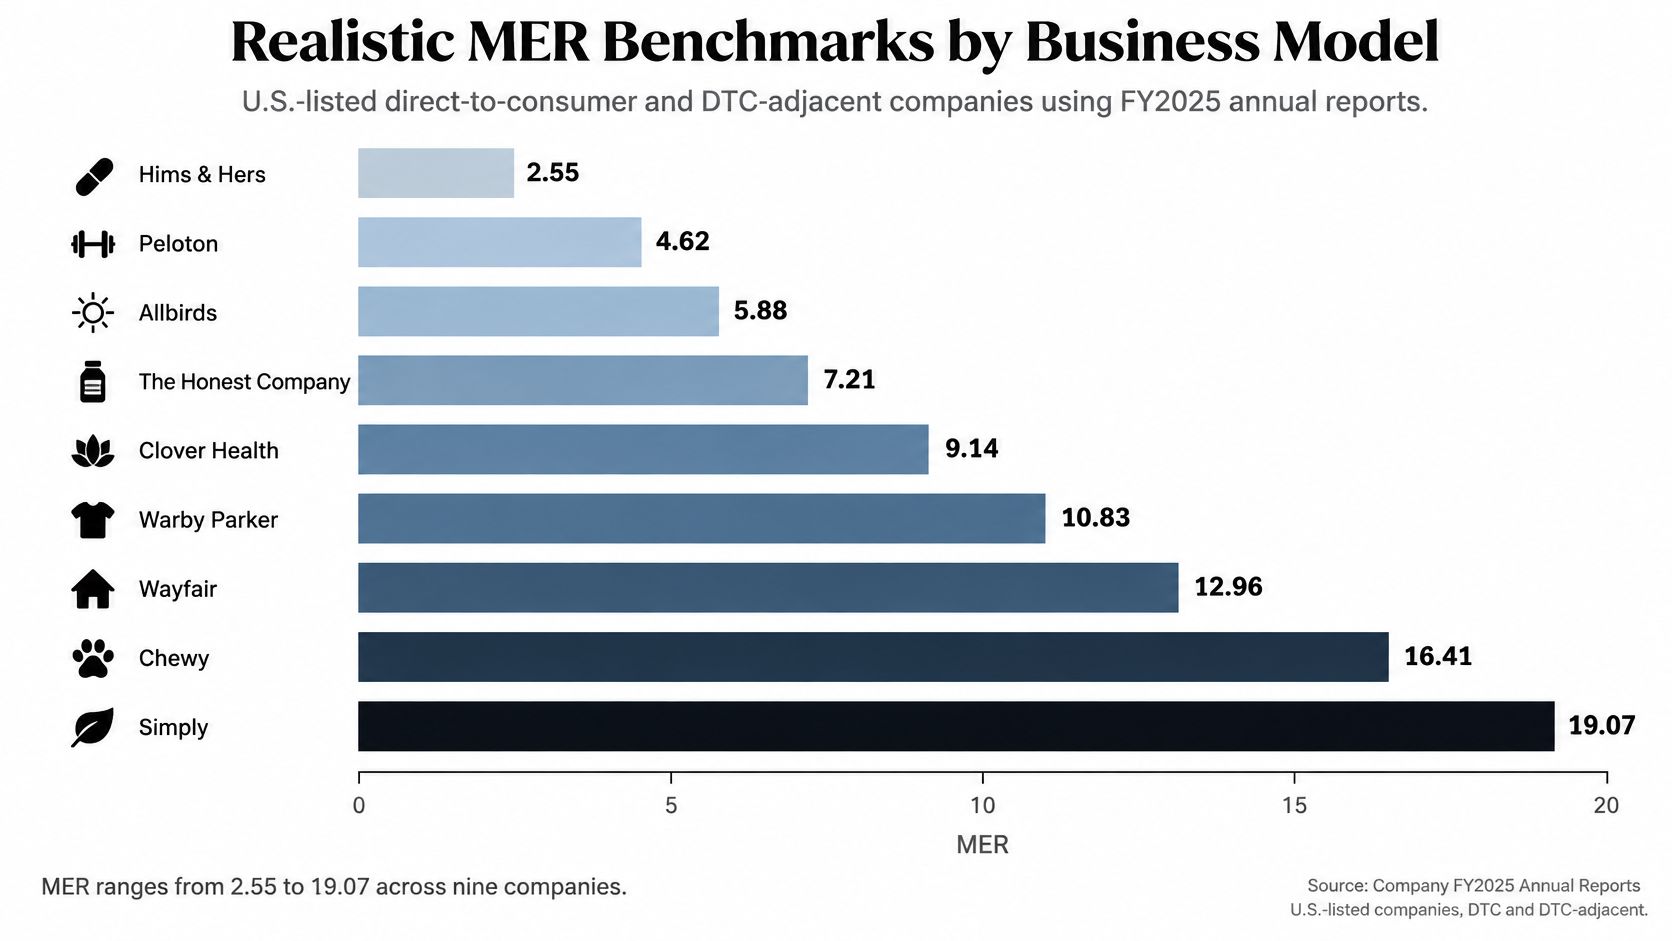
Across nine U.S.-listed direct-to-consumer and DTC-adjacent companies, FY2025 annual reports produced MER values from 2.55 at Hims & Hers to 19.07 at Simply Good Foods, with a median of 8.47 and a revenue-weighted mean of 5.84, according to OWOX's analysis of marketing efficiency ratio. Its wider compilation covering Q1 2023 through Q4 2024 reports the directional benchmarks below.
| Business model or comparison group | Directional MER reference |
|---|---|
| Cross-model compilation | 3.9x median |
| DTC e-commerce | 3.0x to 5.0x practical range |
| B2B SaaS | 2.7x median |
| Subscription commerce | 4.4x median |
The public-company sample is small, and the wider compilation combines published references, category averages and modeled estimates. These aren't standardized targets drawn from identical accounting policies.
Compare economics before comparing multiples
A familiar consumer brand may receive substantial repeat and organic demand. An expanding SaaS company may spend heavily before recognizing the resulting subscription revenue.
Gross margin, buying frequency, brand strength and product category all affect what a sustainable ratio looks like. Accounting scope matters too: a business counting only media spend won't be directly comparable with another including people, production and agency costs.
The benchmark is therefore a rough neighbourhood, not a pass mark. A company shouldn't cut productive investment merely because its ratio sits below a peer with different economics.
Use benchmarks in a decision sequence
- Choose the closest business model. Confirm whether the comparison reflects subscriptions, transactional purchases or a mixture.
- Compare the business with itself. A quarter-over-quarter trend under a fixed definition provides a more actionable operating signal.
- Investigate the reason for the gap. Separate margin differences, customer mix and expense treatment from campaign performance.
- Check the commercial outcome. Pair the ratio with payback, contribution margin, pipeline quality and customer lifetime value before reallocating money.
For subscription teams, the guide to SaaS marketing metrics provides context for keeping efficiency alongside customer and pipeline measures.
A rising ratio accompanied by shrinking qualified pipeline isn't necessarily progress. A falling ratio alongside improving contribution and healthy customer cohorts isn't necessarily failure either.
The useful comparison is the one that changes a decision for a defensible reason. Benchmark chasing without a cost definition rarely meets that standard.
Why a High MER Can Hide Saturation
A high MER can be a warning sign when a business captures existing demand but stops creating future demand. A shop counts every purchase passing through the till, including customers who arrived already intending to buy.
MER counts those sales too. Neither the ratio nor attributed conversions alone isolates what wouldn't have happened without marketing.

Mature brands and branded-search-heavy businesses face an obvious risk: campaigns can appear effective while mainly intercepting buyers who already know the company. In B2B, current spending can also receive credit for sales developed through earlier relationships and lengthy sales work.
Conversely, lower reported MER can accompany better marketing when investment reaches new, non-branded demand. The immediate ratio may weaken before those buyers convert.
Separate observed revenue from incremental contribution
An operational incremental MER view can compare contribution margin from incremental revenue with fully loaded marketing costs. Label it clearly as a contribution-based measure so nobody confuses it with ordinary revenue MER.
Segment the result by acquisition, activation, retention and referral. That prevents a successful retention program from masking weak new-customer growth.
- Randomized holdouts: Withhold the intervention from an eligible control group while keeping other treatment consistent.
- Geo experiments: Vary activity across suitable geographic areas and compare outcomes against the planned baseline.
- Conversion-lift studies: Use an exposed group and control group to estimate additional conversions.
- Matched-market comparisons: When randomization isn't feasible, select markets with similar prior trends and acknowledge the greater uncertainty.
Controlled measurement is the useful complement to attribution illustrated by the Rhoback measurement case study; the accompanying industry finding reports that only 8% of respondents in a 2025 survey used incrementality testing.
Protect the test from misleading comparisons
Promotions, stock shortages, seasonality and demand shocks can make treatment and comparison groups diverge for reasons unrelated to advertising. The test plan should record these risks before launch and monitor whether both groups experienced them similarly.
Cross-channel marketing attribution helps explain journeys and allocate observed credit. Incrementality asks a different question: whether the intervention changed the outcome.
A campaign that takes credit for a sale isn't necessarily a campaign that created a sale.
The concrete action is to schedule a holdout or matched-market test this quarter. Define the intervention, contribution measure and decision threshold before results become visible, then keep the test intact long enough to observe the relevant buying cycle.
Lift MER Across the Funnel, Stage by Stage
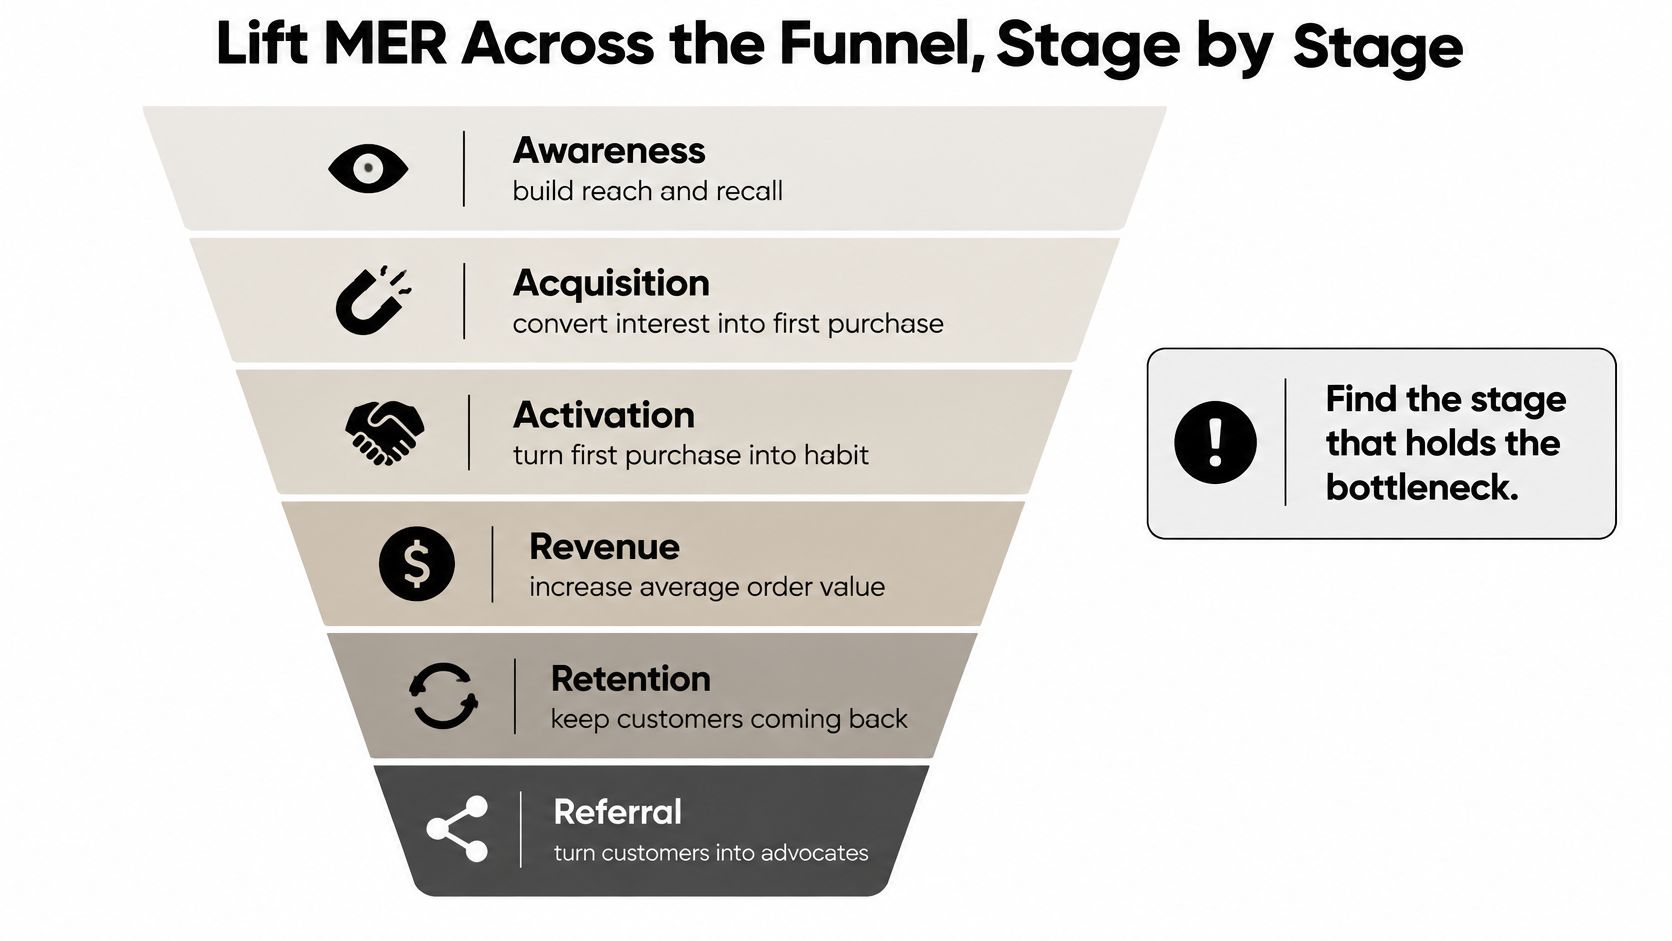
Find the stage that limits revenue before buying more traffic. Better acquisition will not compensate indefinitely for difficult onboarding or customers who never return, so the diagnosis has to come before the budget decision. A stage-by-stage read of conversion usually exposes the constraint quickly: strong traffic with weak activation points at the page or onboarding, while healthy first orders with flat repeat revenue point at retention.
MER levers and first experiments by funnel stage
| Funnel stage | Lever | First experiment |
|---|---|---|
| Awareness | Creative angles and formats that reach new buyers | A/B test two hooks on the same budget for two weeks |
| Acquisition | Budget moved away from campaigns that fall short | Weekly review of each campaign's contribution to MER and its ROAS |
| Activation | Landing page and onboarding friction | Remove one form field or shorten the onboarding email |
| Revenue | Average order value and offer structure | Test a bundle against a single-product offer |
| Retention | Email, SMS and loyalty for repeat buyers | Send a 30-day win-back flow to lapsed buyers and track repeat revenue |
| Referral | Incentives that bring in buyers at low cost | Offer a referral reward to one segment and compare its MER with a control |
These are experiment designs, not promised improvements. Adapt the test window to buying frequency, and hold off on declaring a winner until customers have had a realistic chance to act. A two-week test makes sense for a brand with weekly purchase cycles and very little for one whose customers buy twice a year.
Keep a weekly decision rhythm
Sprints & Sneakers runs budget, forecasting and creative testing in a fixed weekly cycle, where campaigns that perform get more budget and those that fall short are pulled without manual steering.
For an interpretable test, change one variable deliberately. Rebuilding the audience, offer and creative in the same week leaves no way to attribute the result. Judge each campaign by its contribution to MER and its own ROAS; reporting a campaign-level MER would mean allocating blended revenue back to individual channels, which is exactly what the blended ratio exists to avoid.
The practical discipline behind conversion funnel optimization is to connect each experiment to the stage where customers stop progressing.
Fix the constraint rather than the loudest dashboard
A DTC brand with flat MER and weak repeat purchasing faces a different problem than a traffic shortage. Raising acquisition spend would push more first-time buyers into a funnel that loses them, so the team tests the retention flow from the table instead and tracks repeat revenue from treated buyers against those who never received it.
The next quarter's result should include the flow's production costs and any discounts. Otherwise the team could mistake expensive subsidized orders for improved efficiency.
Before launch, write a hypothesis for each stage and a clear pass-or-fail condition for the selected experiment. A useful hypothesis names the customer group, the proposed change and the commercial outcome expected, such as repeat revenue per buyer, instead of stopping at a click target.
Start Your MER Baseline This Quarter
A dependable baseline is worth more than another reporting overhaul. One focused week should produce a usable trend, an economic floor and a test worth funding. Work through this checklist:
-
Calculate MER for the last three quarters. Apply the reporting window and revenue rules from the step-by-step calculation, and flag any period where older records cannot follow them.
-
Pull gross margin from the latest finance report. Check it against the break-even floor before treating any ratio as healthy.
-
Choose the closest benchmark row. Record the gap as context, and add a note on any difference in business model or cost scope.
-
Schedule the incrementality test. Use the holdout design from the saturation section, write the pass-or-fail line before launch and assign an owner to protect the control group.
-
Review monthly and keep a change log. Record every adjustment to the window, revenue definition or spend items, and keep earlier periods reproducible when definitions change.
Turn the baseline into a decision
The monthly review should finish with a budget decision, a diagnostic task or an experiment. If nobody can say what action would follow a better or worse MER, the reporting process needs a clearer purpose.
A useful operating note records the current constraint, the proposed intervention and the evidence needed to continue. That gives finance and marketing something concrete to debate, and it keeps each review tied to a next step.
Sprints & Sneakers clients receive real-time insight into what works, what does not and where the biggest opportunities sit, so they can adjust each month toward the activities that deliver the most.
Bring the three-quarter MER trend, the margin calculation and the unresolved measurement questions to a conversation with Founder Bart about the next stage of growth. Those inputs show whether the constraint sits in the reporting or in growth itself.
See how the agency connects marketing spending to commercial outcomes at Sprints & Sneakers.
Related articles



Frequently asked questions
Growth marketing, AI and automation, SEO, performance marketing, retention strategies, and sustainable business practices.
Weekly. Subscribe to our newsletter to get new articles straight to your inbox.
Absolutely. Everything we publish is designed to be actionable. Take it, test it, and make it your own.
Yes. We publish experiments with real numbers. What worked, what didn't, and what we learned.
Our growth team — strategists, performance marketers, data specialists, and AI builders who work on client campaigns every day.
We're open to it. Reach out via our contact page with your topic and we'll take a look.