
SaaS Marketing Metrics: Formulas and Benchmarks for 2026
The essential SaaS marketing metrics explained: definitions, formulas, funnel benchmarks and a dashboard you can build tomorrow, updated for 2026.
Expansion ARR represented 40% of total new ARR in 2024, up five percentage points year over year, according to Benchmarkit data from 563 SaaS companies. At the same time, median NRR declined from 105% in 2021 to 101% in 2024. That pairing reframes SaaS marketing metrics completely. Existing customers supply more of the growth, yet the base itself isn't getting healthier.
That means a dashboard stuffed with leads, pipeline and new logos can look exciting while durable revenue weakens. The fix isn't more metrics. It's cleaner definitions, cohort cuts and one headline number per funnel stage, so a team can spot the constraint and act on it next week.
Table of Contents
- SaaS Marketing Metrics by Funnel Stage
- Tracking MRR, GRR and NRR Without Mixing Revenue Types
- Calculating CAC, Payback and LTV by Cohort
- Activation and Free-Trial Tests That Cut Early Churn
- Attribution Views That Stop Channels Being Misjudged
- Benchmarks to Compare Your Numbers Against
- Build a Monthly Dashboard and Prioritize What to Track
- Pick Three Metrics This Week and Fix the Common Mistakes
SaaS Marketing Metrics by Funnel Stage
Start with a lookup table the whole team shares. Ten metrics cover most decisions, and each one answers a single question. Print it, pin it above the dashboard and stop arguing about definitions in meetings.
| Metric | Stage | Formula | Question It Answers |
|---|---|---|---|
| CAC | Acquisition | Attributable sales and marketing spend ÷ new customers | What does each new customer cost? |
| Cost per lead | Acquisition | Campaign spend ÷ leads generated | Is paid traffic producing enquiries? |
| Activation rate | Activation | Users completing the key event ÷ new signups | Do new users reach real value? |
| Free-to-paid conversion | Revenue | Paying customers ÷ free users | How many free users become customers? |
| CAC payback | Revenue | CAC ÷ monthly gross profit per customer | How many months until a customer repays acquisition? |
| MRR | Revenue | Sum of normalized monthly value of active subscriptions | How much recurring revenue is live now? |
| LTV | Retention | ARPU × gross margin % ÷ churn rate | What is a customer worth over their lifetime? |
| GRR | Retention | (Beginning MRR minus contraction minus churn) ÷ beginning MRR | How much revenue survives without expansion? |
| NRR | Retention | GRR plus expansion and reactivation MRR | Does the existing customer base grow? |
| Referral rate | Referral | Referred new customers ÷ total new customers | Are customers recommending you? |
Three Families, Not One Long List
Group those ten into families and the dashboard gets easier to read. Pipeline metrics (cost per lead, conversion rates, CAC) show whether demand turns into customers efficiently. Revenue metrics (MRR, free-to-paid conversion, payback) show whether those customers produce recurring money fast enough. Retention metrics (LTV, GRR, NRR, referral rate) show whether the money stays, grows and brings friends.
Two worked examples keep the arithmetic honest. Say a team spends €20,000 on acquisition in a month and wins 50 customers. CAC is €20,000 ÷ 50, which is €400 per customer. Say a single campaign spends €5,000 and produces 250 leads. Cost per lead is €5,000 ÷ 250, which is €20 per lead. Neither number means much alone. The €400 CAC only earns its keep when it's set against payback and LTV, and the €20 lead only matters if those leads qualify.
One Headline Metric per Stage
Six stages, six headline metrics. Anything more per stage becomes decoration.
- Awareness, branded search volume: Are more people searching for the company by name this month than last? Rising branded search means earlier activity is creating memory, not just clicks.
- Acquisition, visitor-to-lead conversion: Does traffic turn into identifiable demand, or does it bounce away anonymous?
- Activation, activation rate: What share of new signups complete one defined event, such as inviting a teammate or finishing a first workflow?
- Revenue, MQL-to-SQL conversion: Do marketing-qualified leads survive sales scrutiny, or does the handoff leak?
- Retention, GRR: How much starting revenue survives the period before any expansion flatters the picture?
- Referral, share of new customers from referral: What slice of new logos arrived because an existing customer recommended the product?
That lifecycle view is where a lifecycle marketing strategy earns its place, because it forces each stage to hand a measured output to the next one. A stage without a headline metric gets budget based on enthusiasm instead of evidence.
Run the Funnel With Real Arithmetic
Track the conversion chain stage by stage rather than one blended rate, because Factors.ai funnel benchmarks put visitor-to-lead conversion at around 2.5%, MQL-to-SQL conversion commonly between 10% and 30%, and the average SaaS SQL-to-opportunity win rate at about 22%. The same source puts a 3:1 or higher LTV-to-CAC ratio as a common target.
Run those numbers on a hypothetical month. 10,000 visitors at 2.5% produce 250 leads. Treat those leads as MQLs and apply a 20% MQL-to-SQL rate, and sales gets 50 sales-qualified leads. Apply a 22% win rate and the month yields roughly 11 customers, before accounting for the separate SQL-to-opportunity step in a real CRM. Now the diagnostic gets interesting. If a team needs 20 customers, it can double traffic, lift lead conversion, improve qualification or raise the win rate, and each lever has a different owner and cost.
Practical rule: Calculate every stage by channel and by month. A blended funnel hides the one channel that's quietly producing leads sales never accepts.
Find the Weakest Stage First
Close with a simple diagnostic. Compare each stage against its benchmark, find the stage furthest below par and fix that one before touching the others. Pouring traffic into a funnel whose MQL-to-SQL rate sits at the bottom of the range just manufactures more rejected leads. Fixing qualification first makes every future euro of traffic spend worth more.
One housekeeping habit protects all of this. State the measurement period in every dashboard header, in plain text, every time. A CAC from a quarter compared with customers from a month produces confident nonsense, and it happens constantly when someone screenshots a chart without its date range.
Tracking MRR, GRR and NRR Without Mixing Revenue Types
MRR is the normalized monthly value of all active subscriptions. An annual contract worth €12,000 contributes €1,000 of MRR, and a one-off onboarding fee contributes nothing, because it doesn't recur. That exclusion trips people up, but it's the whole point. MRR answers one question: how much recurring revenue is live right now?
The cleanest way to report it is the movement bridge described in the SubSummit subscription metrics guide: Ending MRR = Beginning MRR + New MRR + Expansion MRR + Reactivation MRR minus Contraction MRR minus Churned MRR. ARR is MRR × 12.
Build the Bridge Line by Line
Say a company starts the month at €100,000 MRR. During the month it adds €12,000 in new MRR, €4,000 in expansion MRR and €1,000 in reactivation MRR. It loses €2,000 to contraction and €3,000 to churn. Ending MRR is 100,000 + 12,000 + 4,000 + 1,000 minus 2,000 minus 3,000, which equals €112,000. ARR is €112,000 × 12, which equals €1,344,000.
Now extract the retention story. GRR is (100,000 minus 2,000 minus 3,000) ÷ 100,000, which equals 95%. That tells a marketer the base kept 95 cents of every recurring euro before upsells helped. NRR adds expansion and reactivation back in: (95,000 + 4,000 + 1,000) ÷ 100,000, which reaches exactly 100%. The base held its value, no more. Growth came from new logos, not from existing customers expanding.
GRR is the floor and NRR is the ceiling. When the gap between them widens, expansion is doing heavy lifting that retention should be doing.
A Flat NRR Target Misreads Segments
Here's where published benchmarks mislead. According to the SaaS Capital 2025 B2B SaaS retention benchmarks, companies with annual contracts show median NRR of 101% and GRR of 90%, while multi-year-contract businesses reach 103% NRR and 94% GRR. Companies with annual contract values above $250,000 report median GRR of 95%, compared with approximately 91% for lower-ACV businesses.
So a flat "get NRR above 100%" target means different things in different segments. A multi-year, high-ACV business sitting at 100% NRR is underperforming its peer group. A low-ACV, monthly-billed product at 100% might be doing well. Judge each segment against its own contract term and value band, a discipline that sits naturally inside solid customer retention metrics reporting.
Logo Versus Revenue, and Clean Separations
Report retention at logo level and revenue level side by side. A few large-account losses can push revenue churn sharply upward while logo churn looks calm, because two enterprise cancellations out of 400 customers barely move the logo rate. The reverse happens when many tiny accounts leave. Logo churn looks alarming, revenue barely notices. Both views are true, and they demand different responses.
Finally, keep four things in separate reports: bookings, billings, recognized revenue and recurring run rate. A signed annual deal is a booking on day one, a billing when invoiced, recognized revenue across twelve months and MRR at one twelfth per month. Blend them into one KPI and every meeting becomes an argument about which number is real.
Calculating CAC, Payback and LTV by Cohort
Unit economics only work by cohort. A single blended ratio averages a brilliant enterprise channel with a leaky self-serve one and produces a number that describes neither. The three formulas below run in the order a reader uses them: what a customer costs, how fast that cost comes back, and what the customer is ultimately worth.
The cohort view below is the working surface for everything in this section.

Step One, CAC With Everything Loaded
CAC = attributable sales and marketing investment ÷ new customers acquired in the same period, following the definitions in the Subscription Playbook metrics guide. Include media, marketing technology, agencies, allocated personnel and sales costs where they're relevant. Grou's guidance to include labor and overhead in CAC makes the same point from the cost side: a CAC that excludes salaries flatters every channel with heavy human effort behind it.
Worked example. A team spends €60,000 across a quarter, fully loaded, and wins 120 new customers. CAC is €60,000 ÷ 120, which is €500 per customer. Write the period next to the number. A quarterly CAC compared against a monthly customer count is the most common silent error in growth reporting.
Step Two, Payback in Months of Gross Profit
CAC payback is the number of months of gross-profit contribution needed to recover CAC. Note the gross profit part. Revenue-based payback overstates speed because it pretends serving the customer is free.
Continue the example. ARPU is €100 per month and gross margin is 75%, so each customer contributes €75 of gross profit monthly. Payback is €500 ÷ €75, which is about 6.7 months. Until month seven, that cohort is still repaying its acquisition cost. Every euro spent acquiring the next cohort before then comes from cash reserves or earlier cohorts, which is why payback is a cash-flow metric as much as a marketing one. Readers who want the fuller judgement call can check what a good customer acquisition cost looks like against their own margin structure.
Step Three, LTV on Compatible Inputs
LTV = ARPU × gross margin % ÷ customer churn rate. With €100 ARPU, 75% margin and 3% monthly churn, LTV is (100 × 0.75) ÷ 0.03, which equals €2,500. Against the €500 CAC, that's a 5:1 ratio. Comfortable, on paper.
The warning matters more than the arithmetic. ARPU, margin and churn must come from the same cohort over the same period, or the ratio means nothing. Pairing enterprise ARPU with self-serve churn manufactures a fantasy LTV that justifies spend no real segment can repay.
This short walkthrough shows the three calculations chained together on one cohort.
<iframe width="100%" style="aspect-ratio: 16 / 9;" src="https://www.youtube.com/embed/clfYlmidxX0" frameborder="0" allow="autoplay; encrypted-media" allowfullscreen></iframe>Compare Channels on What Happens After Signup
Pair each channel's CAC with activation rate, time-to-value, first-year gross-profit retention and expansion MRR, not cost per lead alone. Say Channel A delivers cheap leads and a €300 CAC, but its customers churn inside 60 days, contributing roughly €150 of gross profit each. That channel loses money on every customer. Channel B costs €800 per customer with a payback past ten months, but its customers stay for years and expand. Channel B wins, and a cost-per-lead report would have killed it. Keep revenue churn and logo churn separate in this comparison too, since a channel bringing many small, short-lived accounts distorts both in opposite directions.
Activation and Free-Trial Tests That Cut Early Churn
A 30% median activation rate leaves substantial room to improve how new users reach value. Define activation as one measurable event that signals a user has experienced the product's core benefit, such as inviting a teammate, connecting an integration or completing a workflow. Then compare day-30 retention for users who complete that event with retention for those who do not. A clear gap makes the event a useful onboarding target; little or no gap suggests it may not capture meaningful value.
Why the First 90 Days Decide Everything
A benchmark synthesis from Userflow's SaaS onboarding benchmarks reports a 30% median SaaS activation rate, an 8% blended free-to-paid conversion rate and approximately 70% of customer churn occurring during the first 90 days. Together, those figures point to a practical priority: help users reach value early, then make it easy to keep using the product. Product education and customer-success support should reinforce the workflows that lead to activation and continued use, rather than waiting until renewal.
Trial Mechanics Change the Numbers
A credit-card requirement can raise conversion among trial starters while reducing the number who begin a trial. The trade-off depends on whether the additional conversion offsets the lost starts. The figures previously used to support this comparison came from a marketing agency, so they do not establish a reliable benchmark. Test the signup mechanics against your own funnel instead.
The Five-Step Trial Test
- Split the cohorts: Send comparable traffic to a card-required signup and a no-card signup at the same time.
- Hold everything else constant: Keep trial length, acquisition source, plan and activation event identical across both groups.
- Measure both ends: Count trial starts and paid conversions for each group over a fixed window.
- Read it as a trade-off: A card requirement may reduce starts while raising the share that buys. Judge it by paid customers produced, not registrations.
- Fix activation before spend: If neither cohort activates, improve the onboarding step before changing the channel budget.
A high signup rate with weak paid conversion means acquisition is bringing in people who sample the product and leave. Track activation alongside paid conversion to see where the trial loses momentum.
Attribution Views That Stop Channels Being Misjudged
Last-click reporting compresses a long B2B buying journey into one interaction. In a UserMaven dataset covering 186,000 opportunities, the average journey contained 27 touchpoints, crossed a median of four channels and took 41 days from first touch to opportunity creation, according to its B2B SaaS attribution benchmark. Yet 46% of companies used last-click as their primary model, while 45% used multi-touch approaches. One final click cannot show how the other interactions contributed.
Report Three Views Side by Side
For each channel, compare three views in one report:
- First-touch influence: How often does this channel start journeys that eventually become pipeline?
- Last-touch conversion: How often does it appear at the final step before conversion?
- Sourced or influenced pipeline: What pipeline value is associated with journeys that included this channel?
For example, paid search may appear in few last-touch conversions but frequently at the start of journeys that later become opportunities. That points to an opening role, while other channels help move the deal forward. Cutting spend based only on last-touch results can reduce future pipeline before the effect is visible. UserMaven's dataset found the largest gap between last-click attribution and the broader journey view for paid search, making it a useful channel to examine with these three views. A consistent cross-channel marketing attribution approach helps keep the comparisons meaningful month to month.
Tie Spend to Revenue, Then Test
Connect channel spend to CRM pipeline and closed revenue, then check that the same definitions are used across reports. Sprints & Sneakers connects Google Ads to a B2B client's CRM and sets targets on cost per qualified lead rather than cost per form fill.
Where the platform allows it, compare accounts exposed to a campaign with accounts that were not exposed over the same 90-day period. Check whether the exposed group creates opportunities faster, while accounting for differences between the groups.
Attribution indicates where to investigate; it does not prove that a channel caused a result. Treat the model as a hypothesis generator, then test the changes it suggests.
Benchmarks to Compare Your Numbers Against
A median can make a weak segment look healthy. Use benchmarks to frame questions, not set targets: compare companies with similar contract values, terms and sales motions. Fundl's SaaS growth benchmarks by stage offers a stage-based comparison.
| Metric | Benchmark | Use It To |
|---|---|---|
| Sales and marketing spend per $1 of new-customer ARR | $1.76 median in 2023, according to [Benchmarkit's 2024 SaaS Performance Metrics report](https://www.benchmarkit.ai/2024benchmarks) | Compare acquisition efficiency, allowing for differences in sales motion |
| CAC per customer | $702 median in 2025, according to [Widelly's SaaS Marketing Benchmark Report](https://widelly.com/market-reports/saas-marketing-benchmark-report/) | Sanity-check CAC against the market, not as a target for every contract size |
A blended NRR target can conceal weakness by contract value and term. If large, multi-year accounts expand while smaller annual accounts contract, the company-wide figure may hold steady even as customer health deteriorates in a key segment. Break NRR and GRR out by contract value, term and cohort before deciding whether retention is strong.
Expansion can also mask a weakening base. Rising NRR may come from a few accounts spending more while other customers downgrade or leave. Track the source of revenue change alongside the headline figure: expansion, contraction and churn answer different questions.
Published benchmarks need context. The $702 median CAC does not say whether acquisition is efficient for a product with a $40,000 annual contract; the right comparison depends on contract economics and sales motion. Use market figures to prompt investigation, then judge performance against comparable segments and your own revenue mix.
Build a Monthly Dashboard and Prioritize What to Track
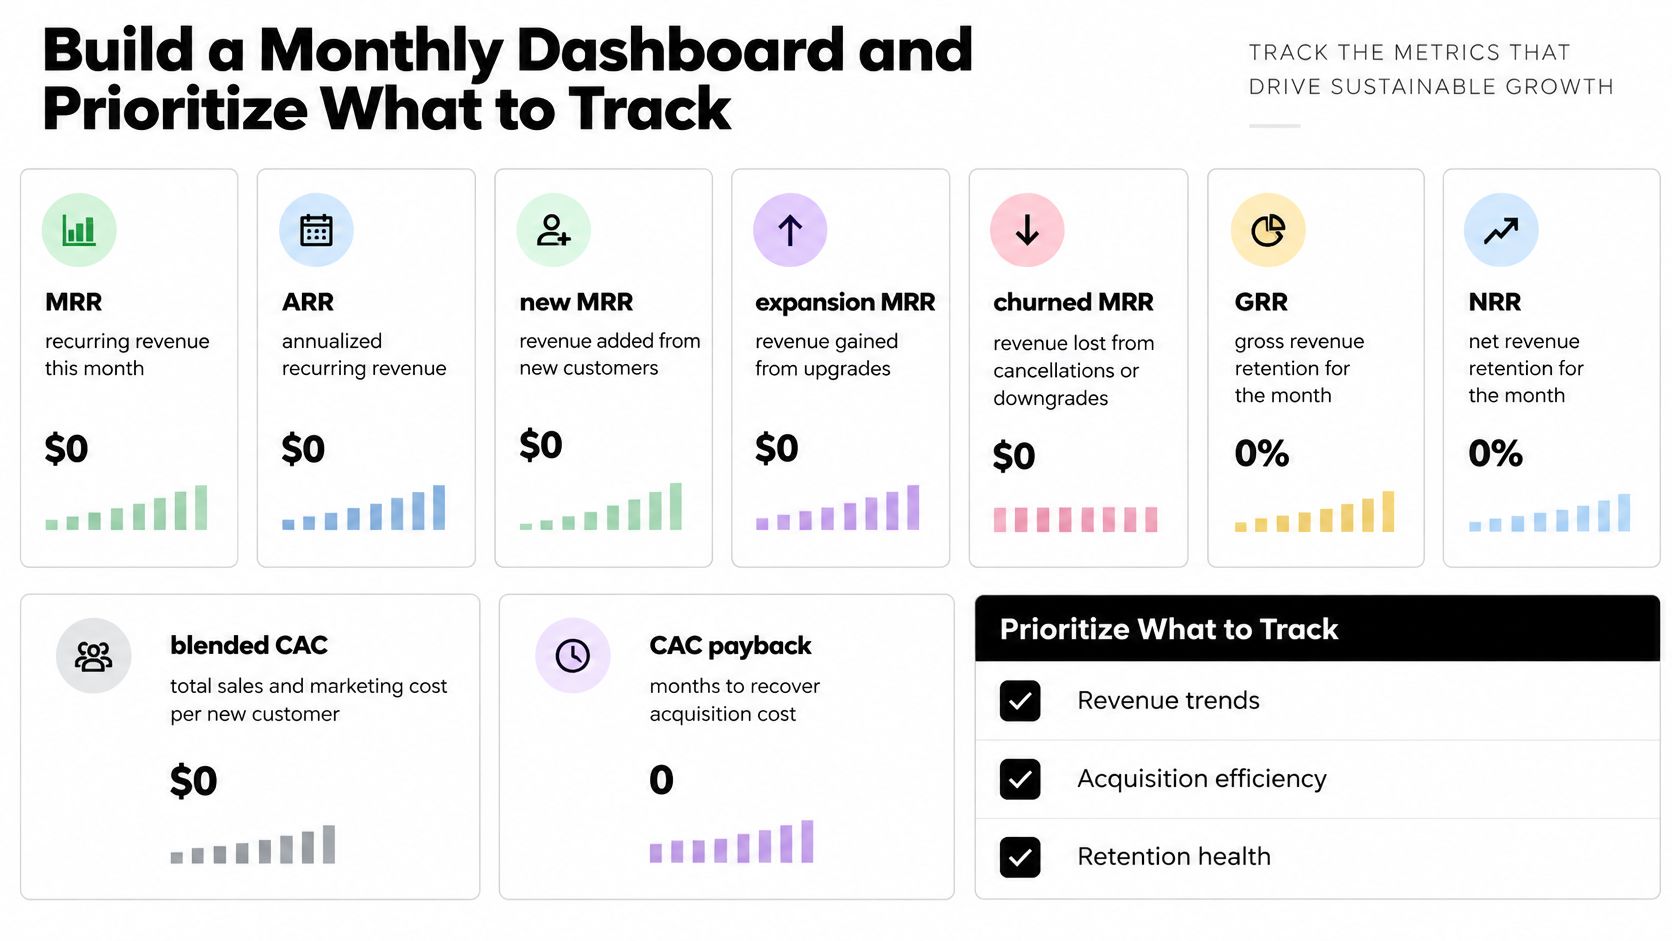
A useful monthly dashboard makes it clear what changed, where performance is weak, and who should act. Start with a spreadsheet; the structure matters more than the software.
The Four Blocks
Top row, revenue truth. Show MRR, ARR, new MRR, expansion MRR, churned MRR, GRR and NRR for the month. These figures show whether recurring revenue grew and which revenue movements drove the change.
Second row, acquisition efficiency. Include blended CAC, CAC payback by channel and LTV-to-CAC for the last three cohorts. Three cohorts help distinguish a developing pattern from an unusual result in a single month.
Third block, the cohort table. Put acquisition month in rows and months since signup in columns, with retained revenue in each cell. A cohort that declines faster than its peers gives you a place to investigate: compare its acquisition campaign and onboarding experience with those of stronger cohorts.
Fourth block, segment cuts. Break out metrics by channel, plan, industry, company size and contract age. Without these cuts, strong overall results can conceal a segment that is weakening.
Reconcile the Sources or Expect Arguments
Use the CRM for pipeline, billing data for MRR and product data for activation. Their totals may differ because systems record cancellations, pauses and upgrades at different times. Show a reconciliation line and label the reason for any gap. For example, a visible €800 difference with an explanation is more useful than a mismatch no one can account for. A clear layout for a marketing analytics dashboard can help keep those figures readable.
For teams deciding which business metrics deserve a permanent slot, choosing meaningful business development KPIs offers a useful filter: keep a metric when a named owner knows what action to take if it changes.
Prioritize by Stage
- Starting paid acquisition: Track activation, CAC and payback. These show whether new users reach value and whether acquisition costs are being recovered.
- Scaling up: Add cohort NRR and payback by channel. Use them to see whether revenue quality and acquisition efficiency vary across cohorts or sources.
- Selling large contracts: Add GRR by segment. A few high-value accounts can make overall retention look healthy while smaller accounts contract.
Close the review with one named bottleneck, one logged experiment and one owner. Each dashboard metric should have an owner, formula, data source and reporting period. If any of those are missing, define them before using the metric to guide decisions.
Pick Three Metrics This Week and Fix the Common Mistakes
A dashboard with dozens of metrics can still leave the team unsure what to fix. Choose three measures tied to the weakest funnel stage, define them consistently, and use them for a month. A narrow set makes it easier to connect a change in performance to a specific action.
Match the Three Metrics to the Bottleneck
If visitor-to-lead conversion is weakest, track cost per lead, lead quality (the share sales accepts) and conversion by landing page. If activation is weakest, track the chosen activation event, time to complete it and day-30 retention for completers versus non-completers. If NRR is flat, track expansion MRR by cohort, the number of accounts expanding and the number contracting.
A flat NRR can hide very different customer patterns. For example, expansion from a few high-value contracts may offset contraction across many smaller accounts. Add the number of expanding and contracting accounts to the rate, and compare results by contract value and term. That reveals whether growth comes from broad customer health or a narrow set of expansions.
Five Mistakes and Their Fixes
- Mixing bookings, billings and MRR in one KPI: Report MRR on its own line, using billing data and excluding one-off fees. Give bookings and billings separate reports.
- A blended CAC hiding a weak channel: Split CAC by channel and cohort. A blended average can conceal a channel whose acquisition cost is too high for the customers it brings in.
- Counting signups as activation: Define one event tied to real value and measure day-30 retention for people who complete it. Signups measure curiosity; activation measures whether users reach value.
- An NRR lifted by one enterprise upsell: Count expanding and contracting accounts alongside the percentage. One large expansion can make NRR look healthy while many customers shrink. Compare NRR by contract value and term to expose that imbalance.
- Crediting last touch alone: Keep first-touch, last-touch and influenced pipeline in every channel report. A channel that starts journeys may look ineffective in a last-touch view, even when it contributes to later pipeline.
The audit test: If spend can't be traced to revenue in a single sheet, the constraint is tracking, not budget. Scaling spend first only scales the guessing.
Run the 30-Minute Audit
Set a timer for 30 minutes and check the current dashboard against the ten-metric lookup table. Which metrics are missing? Which lack a stated period, a named owner or a formula two people would calculate the same way? Can each euro of channel spend be followed through pipeline to revenue in one place?
For example, an activation metric based on logins does not show whether users reached value. Replace it with a defined activation event, then check retention for people who complete it. Fix unclear definitions before the next budget increase. Clean numbers won't grow the company by themselves, but they make it easier to choose and assess the next experiment.
Sprints & Sneakers helps B2B and SaaS scale-ups identify a funnel bottleneck and run focused experiments across acquisition, activation, revenue and retention. Teams seeking to connect SaaS marketing metrics across CRM, billing and product data can learn more about Sprints & Sneakers.
Related articles



Frequently asked questions
Growth marketing, AI and automation, SEO, performance marketing, retention strategies, and sustainable business practices.
Weekly. Subscribe to our newsletter to get new articles straight to your inbox.
Absolutely. Everything we publish is designed to be actionable. Take it, test it, and make it your own.
Yes. We publish experiments with real numbers. What worked, what didn't, and what we learned.
Our growth team — strategists, performance marketers, data specialists, and AI builders who work on client campaigns every day.
We're open to it. Reach out via our contact page with your topic and we'll take a look.